

The Great Rotation in equities is underway, with the U.S. large-cap tech sector losing its dominance as other sectors, markets, and asset classes take over.
And dominance it is: Nvidia Corp. (NVDA:NASDAQ) alone has a larger valuation than the entire markets of Canada or the U.K. That alone might make one scratch one's head. The U.S. market had a good year: up 17% (for the S&P) is hardly shabby. But this was barely half of the international markets (per MSCI World ex-US Index) while specific long-ignored asset classes came to the fore: copper equities rose 82% while gold and silver jumped 155% (per iShares Copper Miners ETF and VanEck Gold miners ETF).
There Are Many Signs of a Top
Signs of a top in U.S. stocks abound. The most obvious sign is extreme valuation. By most measures, the market is more expensive today than it was in 2022, 2008, 2000, and even 1929.
There are many illustrations we could provide of this, price to earnings, price to sales, price to book, the Schiller CAPE ratio, and more. This is a fact, not conjecture.
Of course, markets can stay overvalued for long periods, as indeed has this one, but there are signs that the "end is nigh." Market concentration is a record (the gap between the index and an equal-weighted index, for example, has never been great).
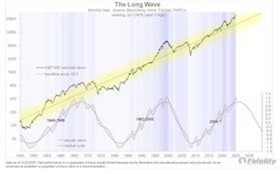
Market speculation is extreme, with margins up over 40% in the last year, record foreign and retail participation, and new speculative vehicles (such as 3x ETFs and one-day options) created to feed the appetite. Simply the length of this bull market (see graph) should give pause. Investor David Snyder has a list of 27 "boxes to check for near the end of the secular bull market," and he says that now all 27 are checked.
The Market Leaders Are Now Rolling Over
That alone should give pause. Market action is also signaling something is up, with the S&P index only barely etching out a new high in the last two months, while leader Nvidia is down meaningfully over this period. One by one, in September, October, and November, the Magnificent Seven have been topping Microsoft Corp. (MSFT:NASDAQ), Apple Inc. (AAPL:NASDAQ), and Amazon.com Inc. (AMZN:NASDAQ). Yes, the Great Rotation is underway. There is an old saying that a market bottom may be an event, but a top is a process. We are experiencing that process unfolding now.
Foreign Markets Taking the Lead From the US
The most obvious beneficiaries have been, and will likely continue to be, both international markets and commodity stocks. Even after that huge outperformance, international equities are still the cheapest they have been relative to the U.S. for 50 years. We expect this outperformance to continue for a few years, as it usually does when foreign markets outperform by a wide margin.
Relative leadership moves in a long cycle: this period of U.S. dominance has lasted nearly 15 years — the U.S. bull market has been going on longer, of course, 17 years now, almost a record — while the previous period of international dominance lasted seven years.
It would be highly unusual for foreign markets to outperform the U.S. by only one year. To return to long-term values relative to the U.S., international markets would have to triple (assuming the U.S. stays flat). And foreign equities are getting help from economic fundamentals, and many foreign economies are growing faster than the U.S., while a decline in the dollar leads many U.S. investors to look abroad.
Commodity Stocks Were 2025's Top Performers
As for commodity equities, despite the huge rallies last year, they remain close to 100-year lows relative to the stock market. So there is plenty of scope for a return to more average relative valuations. The traditional factors that can lead to higher resource prices — including significant underinvestment over a period — are certainly in place. So too is the likelihood of higher inflation and a lower dollar. Resource cycles tend to be long, so, again, we should not expect the copper and gold outperformance to be a one-off.
But there is now something else. For the AI sector to be successful — and meet current goals — natural gas, uranium, copper, and silver must all go up significantly. The commodities are the gold miners' picks and shovels for the AI sector. Planned AI capex for this year and next is $2 trillion, with 850 data centers slated to be built in the U.S. over the next five years. Even if projections are cut in half, there will still be a massive pick-up in demand for these commodities, and the inability of production to keep up will mean higher prices.
Other Parts of the Market Have Lagged and Are Undervalued
Other sectors of the market remain at extreme levels of relative undervaluation: value is at its cheapest relative to growth in more than 50 years. Value stocks would need to compound at 20% per year more than growth stocks for five years to return to their long-term relative valuations. Small caps are also undervalued relative to large caps.
So as the leaders of the long U.S. bull market roll over, the emphasis should be on value and small-cap stocks, on sectors that have lagged, but most of all on international markets and commodity stocks.
Do You Want To Be Shocked?
We referred to the potential end of the secular bull market.
Most would consider that this got underway in early 2009, after the Great Financial Crisis. But if one takes a longer-term view, one could argue that the bull market started far earlier, and we have seen a growing "financialization" of the economy for nearly 40 years.
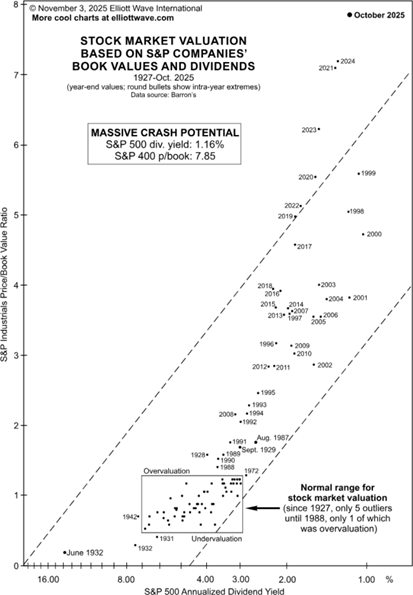
One analyst who looks at markets through a very long telescope is Robert Prechter of the Elliott Wave Theorist.
He has produced a stunning graphic showing how stock market valuations in this period have become progressively more extreme, but significantly well above the 60-year period before.
When he showed an earlier version of what he calls the "Pluto chart" in his presentation at the New Orleans conference, it was met with audible gasps.
Writes Mr.. Prechter, from EWI's Elliott Wave Theorist, November 14, 2025, "at the end of last month, investors were paying 7.85 times the book value of S&P 400 Industrial companies, and they were content with a measly 1.16% annual dividend yield from companies in the S&P 500 Composite Index. T-bills pay more than triple that amount. Clearly, there is no income reason to buy stocks; the only reason to buy them is a belief that other investors will bid prices even higher than they already are. [This chart] is a snapshot of today's unprecedented degree of financial optimism."
Call It What You Like, This Is Bullish for Gold
When the Federal Reserve launched its new Treasury buying program last month, Chairman Jerome Powell and others went out of their way to emphasize that this was not QE. Well, QE or not, something dramatic occurred at the end of the year, as the Fed started purchasing Treasuries at a frantic pace, $160 billion in "reverse repos" during the month, most of it in the last few days of the year, with an unprecedented $100 billion plus on the last day of the year.
This is a multiple of the Fed's target for $40 billion a month in its "Reserve Management Purchases" program announced after its last meeting.
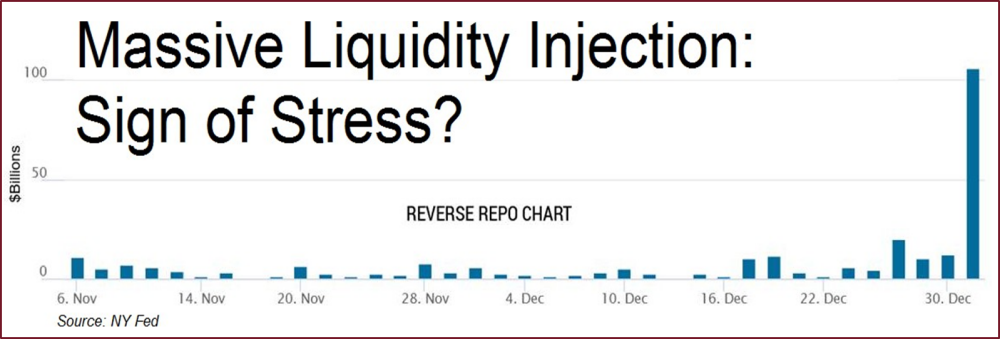
To be sure, the reverse repo purchases are a separate program. But both represent the Federal Reserve purchasing Treasuries and adding liquidity. The press dutifully reported that this was to "steady the markets over year-end."
Was it perhaps connected with the then-pending Venezuela operation?
There is speculation that it could be tied to a major bank unable to meet margin calls on a large short silver position.
QE or note QE, such massive liquidity injections are wildly bullish for gold, even more so than lower interest rates, and the market's action since the Fed announcement bears that out.
TOP BUYS this week include Metalla Royalty & Streaming Ltd. (MTA:TSX.V; MTA:NYSE American), Midland Exploration Inc. (MD:TSX.V), Lara Exploration Ltd. (LRA:TSX.V), and Kingsmen Creatives Ltd. (KMEN:SI).
| Want to be the first to know about interesting Silver, Copper and Gold investment ideas? Sign up to receive the FREE Streetwise Reports' newsletter. | Subscribe |
Important Disclosures:
- As of the date of this article, officers and/or employees of Streetwise Reports LLC (including members of their household) own securities of Metalla Royalty & Streaming Ltd., Midland Exploration Inc., Apple Inc., and Lara Exploration Ltd.
- Adrian Day: I, or members of my immediate household or family, own securities of: Metalla Royalty & Streaming Ltd., Midland Exploration Inc., Lara Exploration Ltd., and Kingsmen Creatives Ltd. My company has a financial relationship with: None. My company has purchased stocks mentioned in this article for my management clients: Metalla Royalty & Streaming Ltd., Midland Exploration Inc., Lara Exploration Ltd., and Kingsmen Creatives Ltd. . I determined which companies would be included in this article based on my research and understanding of the sector.
- Statements and opinions expressed are the opinions of the author and not of Streetwise Reports, Street Smart, or their officers. The author is wholly responsible for the accuracy of the statements. Streetwise Reports was not paid by the author to publish or syndicate this article. Streetwise Reports requires contributing authors to disclose any shareholdings in, or economic relationships with, companies that they write about. Any disclosures from the author can be found below. Streetwise Reports relies upon the authors to accurately provide this information and Streetwise Reports has no means of verifying its accuracy.
- This article does not constitute investment advice and is not a solicitation for any investment. Streetwise Reports does not render general or specific investment advice and the information on Streetwise Reports should not be considered a recommendation to buy or sell any security. Each reader is encouraged to consult with his or her personal financial adviser and perform their own comprehensive investment research. By opening this page, each reader accepts and agrees to Streetwise Reports' terms of use and full legal disclaimer. Streetwise Reports does not endorse or recommend the business, products, services or securities of any company.
For additional disclosures, please click here.
Adrian Day Disclosures
Adrian Day’s Global Analyst is distributed for $990 per year by Investment Consultants International, Ltd., P.O. Box 6644, Annapolis, MD 21401. (410) 224-8885. www.AdrianDayGlobalAnalyst.com. Publisher: Adrian Day. Owner: Investment Consultants International, Ltd. Staff may have positions in securities discussed herein. Adrian Day is also President of Global Strategic Management (GSM), a registered investment advisor, and a separate company from this service. In his capacity as GSM president, Adrian Day may be buying or selling for clients securities recommended herein concurrently, before or after recommendations herein, and may be acting for clients in a manner contrary to recommendations herein. This is not a solicitation for GSM. Views herein are the editor’s opinion and not fact. All information is believed to be correct, but its accuracy cannot be guaranteed. The owner and editor are not responsible for errors and omissions. © 2023. Adrian Day’s Global Analyst. Information and advice herein are intended purely for the subscriber’s own account. Under no circumstances may any part of a Global Analyst e-mail be copied or distributed without prior written permission of the editor. Given the nature of this service, we will pursue any violations aggressively.


