
The major moving average levels for the benchmark U.S. stock market indices, BRIC countries and South Africa are shown in the table below. After the nascent correction, most major indices are within striking distance of their 50-day moving averages. Emerging market indices like the Shanghai Composite Index, Bombay Sensex and Brazilian Bovespa have already breached the 50-day lines. However, all the indices in the table are still trading above their key 200-day moving averages.
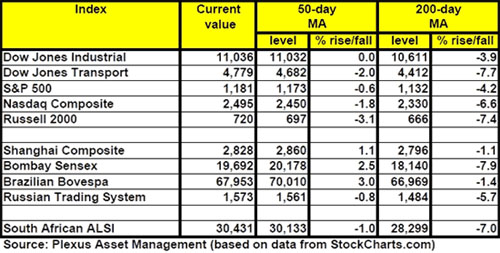
David Fuller (Fullermoney) provides the following perspective: "Technical evidence of this corrective phase can now be seen in the combinations of recently failed upside breaks, downward dynamics, breaks of rising lows within the prior short-term uptrends and the ranging loss of upside momentum. It would be prudent to expect this process to continue for a while longer in what is at least a partial mean reversion towards the rising 200-day moving averages."
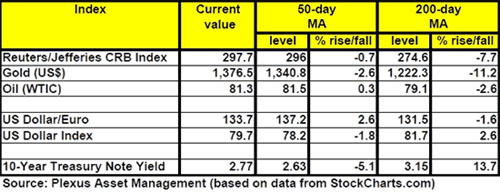
The table below shows moving averages for the other major asset classes—commodities, gold, currencies and government bonds. Interestingly, the Reuters/Jeffries CRB Index is still marginally above its 50 dma, whereas WTI Crude has just breached the 50-day line. The U.S. Dollar Index's recent strength pushed the greenback above its 50 dma (but still below the key 200 dma), whereas the U.S. dollar/euro exchange rate has fallen below its 50 dma (but still above the 200 dma).
Gold bullion remains comfortably above all the key moving averages, while the 10-year Treasury Note yield has breached the 50 dma but still has some way to go to give a primary sell signal and the commencement of a secular bear market by crossing the 200 DMA.
I've been warning for some time that "risk off" could be the order of the day for a while and remain cautious regarding risky assets.
David Fuller (Fullermoney) provides the following perspective: "Technical evidence of this corrective phase can now be seen in the combinations of recently failed upside breaks, downward dynamics, breaks of rising lows within the prior short-term uptrends and the ranging loss of upside momentum. It would be prudent to expect this process to continue for a while longer in what is at least a partial mean reversion towards the rising 200-day moving averages."
The table below shows moving averages for the other major asset classes—commodities, gold, currencies and government bonds. Interestingly, the Reuters/Jeffries CRB Index is still marginally above its 50 dma, whereas WTI Crude has just breached the 50-day line. The U.S. Dollar Index's recent strength pushed the greenback above its 50 dma (but still below the key 200 dma), whereas the U.S. dollar/euro exchange rate has fallen below its 50 dma (but still above the 200 dma).
Gold bullion remains comfortably above all the key moving averages, while the 10-year Treasury Note yield has breached the 50 dma but still has some way to go to give a primary sell signal and the commencement of a secular bear market by crossing the 200 DMA.
I've been warning for some time that "risk off" could be the order of the day for a while and remain cautious regarding risky assets.


