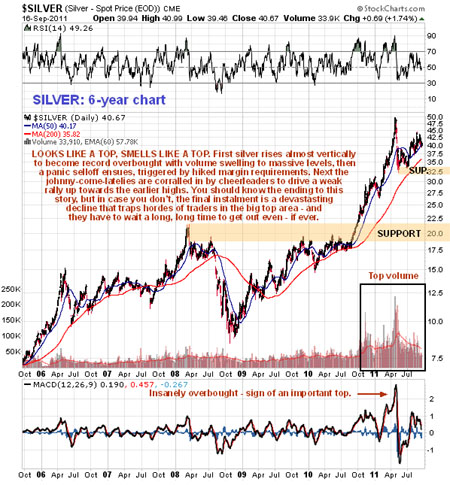
On its 6-year chart silver looks like it is completing a classic large top formation. First it rose vertically to hit its most overbought levels late in April since the good old days of the Hunt brothers back in 1980. Then a panic selloff hit, triggered ostensibly by hiked margin requirements (of course, its being insanely overbought had nothing to do with it), all of which was accompanied by the huge volume characteristic of a top. Lastly, the johnny-come-latelies are corralled into silver by proliferating cheerleaders to drive the weak rally back towards the highs that we have seen over the past couple of months. There is just one instalment left to go, the drop down to the support shown at the lower boundary of the top area, the failure of that support, and the final devastating plunge that leaves hordes of silver speculators hung up in the large top area and smarting from massive losses. Clivemaund.com subscribers are prepared for this with our Complete Toolbox for Capitalizing on a Gold & Silver Plunge.
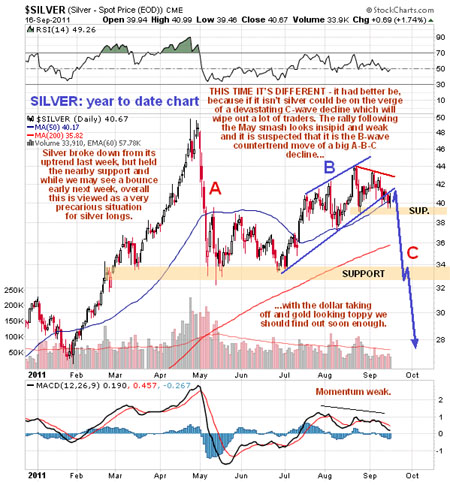
The likely reason for a severe decline in silver, and in commodities generally, and a heavy correction in gold, which is another deflationary downwave that has been signaled by the dollar breakout, is discussed in more detail in the Gold Market update.
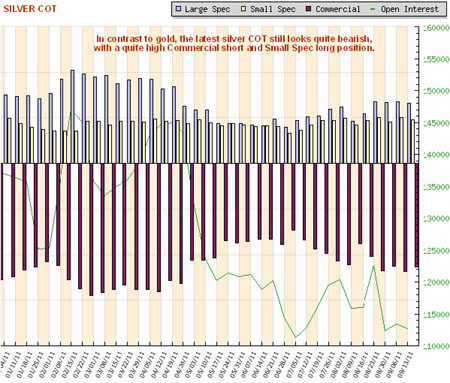
The latest silver COT, shown below, looks quite bearish with a quite high Commercial short and Small Spec long position. In comparison, the gold COT looks considerably more positive.