
At first glance gold looks like it may be about to advance out of a bull Flag, but there are a number of factors in play that we will examine that suggest that any near-term advance won't get far before it turns and drops again, and that a longer period of consolidation and perhaps reaction is necessary before it makes significant further progress.
On the 6-month chart we can see how gold stabbed into a zone of strong resistance on the Iran crisis around the time Iran's general was murdered, but after a couple of bearish looking candles with high upper shadows formed, it backed off into what many are taking to be a bull Flag.

The 10-year chart makes it plain why gold is vulnerable here to reacting back over the short to medium term, because it has advanced deep into "enemy territory": the broad band of heavy resistance approaching the 2011 highs, with a zone of particularly strong resistance right where it is now. It would be healthier and increase gold's chances of breaking out to new highs if it now backed off into a trading range for a while to moderate what now looks like excessive bullishness.

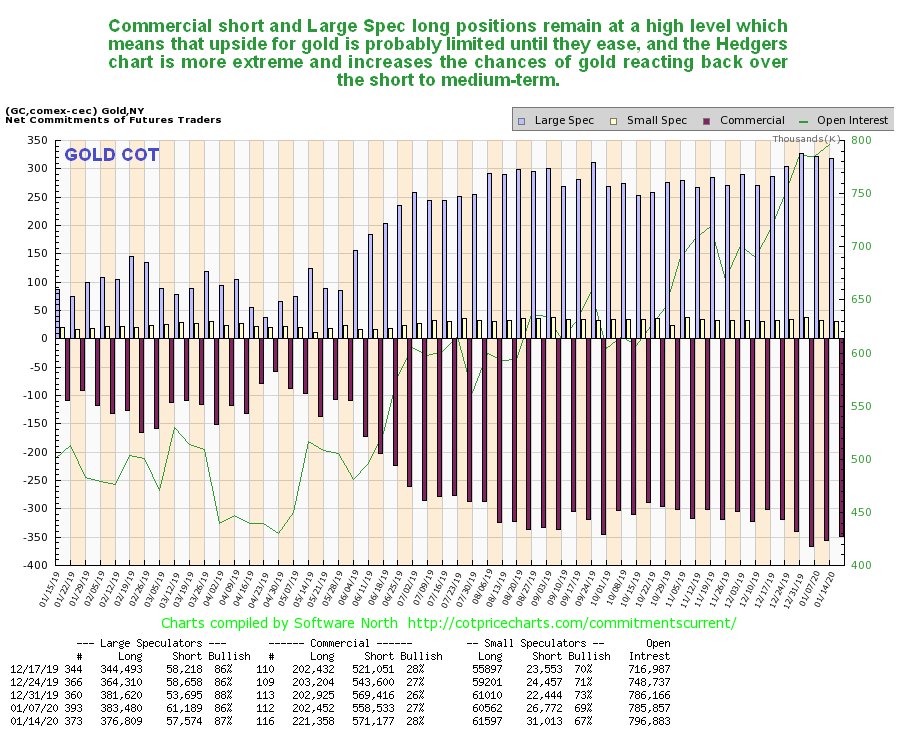
Thus it remains a cause for concern (or it should be for gold bulls) to see gold's latest COTs continuing to show high Commercial short and Large Spec long positions. Is it going to be different this time? The latest Hedgers' charts that we are now going to look at suggest not.
Click on chart to pop-up a larger, clearer version.
The COT chart only goes back a year. The Hedgers' charts shown below, which are a form of COT chart, go back many years, and frankly, they look pretty scary.
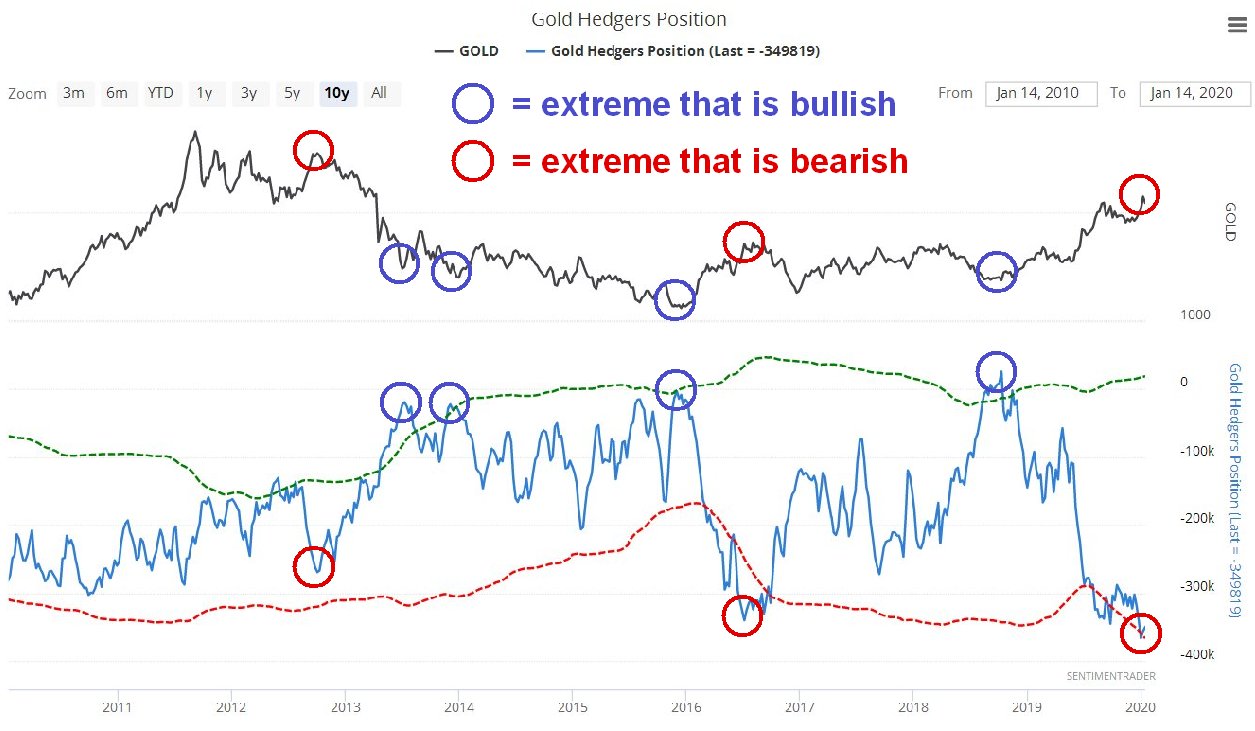
We'll start by looking at the Hedgers' chart that goes back to before the 2011 sector peak. On it we see that current Hedgers positions are at extremes that way exceed even those at the peak of the 2012 sucker rally, which was followed by the bulk of the decline in the bear market that followed. Does this mean that we are going to see another bear market like that? No, it doesn't, but it does mean that these positions will probably need to moderate before we see significant further gains.
Click on chart to pop-up a larger, clearer version.
Chart courtesy of sentimentrader.com
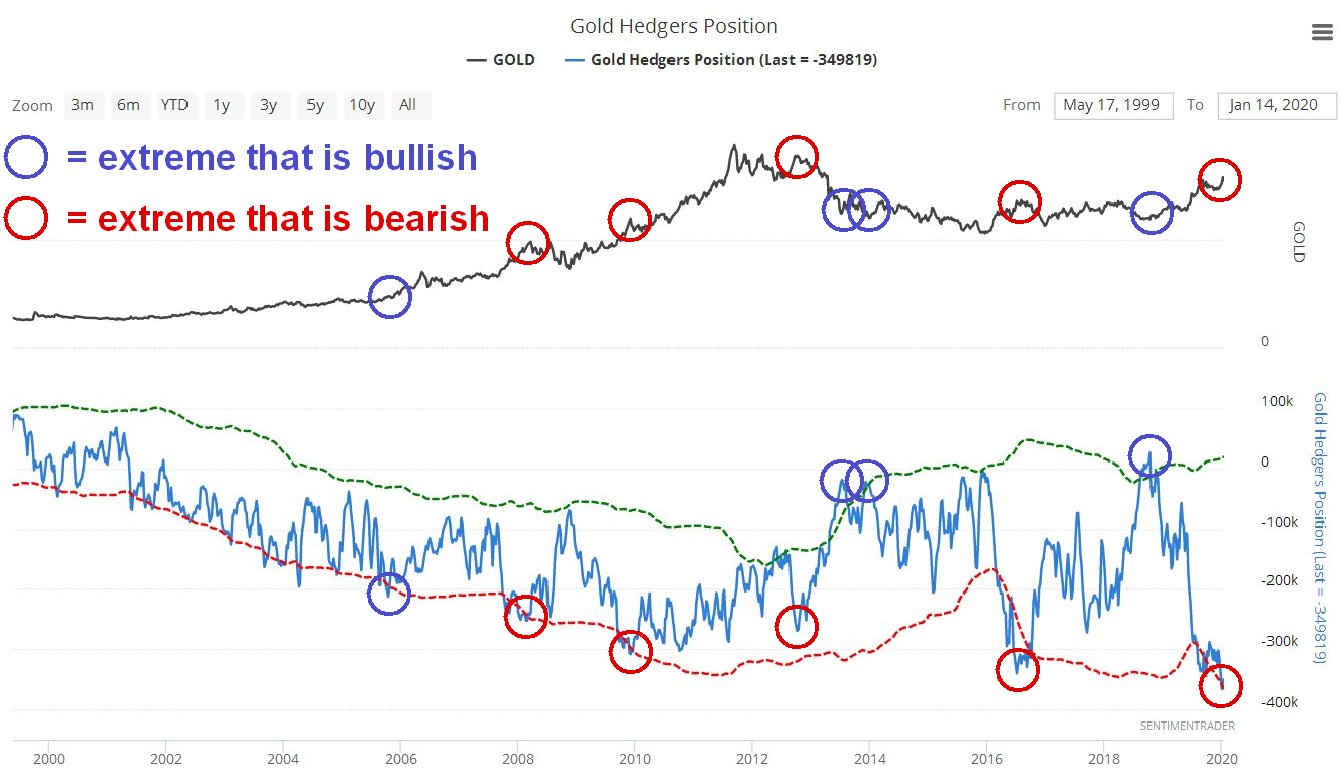
Looking at the Hedgers' chart going way back to before the year 2000, we see that the current readings are record readings by a significant margin and obviously increase the risks of a sizeable reaction. We can speculate about what the reasons for a decline might be, one possibility being the sector getting dragged down by a stock market crash after its blowoff top, which may be imminent, as happened in 2008, since it remains to be seen whether investors will rush into the sector as a safe haven in the event of a market crash.
Click on chart to pop-up a larger, clearer version.
Chart courtesy of sentimentrader.com
Turning now to precious metals stocks, we see on its latest 10-year chart that GDX still looks like it is completing a giant Head-and-Shoulders bottom pattern. However, it is currently dithering just beneath resistance at the top of this base pattern, which means that it is vulnerable to backing off.

So, how then does gold stock sentiment look right now? As we can see on the 5-year chart for the Gold Miners' Bullish Percent Index, bullishness towards the sector is now at a very high level, 84.6%, which makes it more likely that stocks will drop soon rather than rally, and what they could do, of course, is rally some to increase this level of bullishness still further, and then drop.

Does all this mean that investors in the sector should suddenly rush for the exits? No, it doesn't, especially as the charts for many individual stocks across the sector look very bullish, and it may be that all that is needed is a cooling period of consolidation. However it does make sense to use hedges at extremes, such as leveraged inverse ETFs, and better still options as insurance, which have the advantage of providing protection for a very small capital outlay, a fine example being GLD puts, which are liquid with narrow spreads. We did this just ahead of the recent peak when Iran lobbed a volley of missiles at Iraq. We will not be selling our strongest gold and silver stocks, but instead look to buy more on dips.
Article originally published on CliveMaund.com on Sunday, January 19, 2020.
Clive Maund has been president of www.clivemaund.com, a successful resource sector website, since its inception in 2003. He has 30 years' experience in technical analysis and has worked for banks, commodity brokers and stockbrokers in the City of London. He holds a Diploma in Technical Analysis from the UK Society of Technical Analysts.
[NLINSERT]Disclosure:
1) Statements and opinions expressed are the opinions of Clive Maund and not of Streetwise Reports or its officers. Clive Maund is wholly responsible for the validity of the statements. Streetwise Reports was not involved in the content preparation. Clive Maund was not paid by Streetwise Reports LLC for this article. Streetwise Reports was not paid by the author to publish or syndicate this article.
2) This article does not constitute investment advice. Each reader is encouraged to consult with his or her individual financial professional and any action a reader takes as a result of information presented here is his or her own responsibility. By opening this page, each reader accepts and agrees to Streetwise Reports' terms of use and full legal disclaimer. This article is not a solicitation for investment. Streetwise Reports does not render general or specific investment advice and the information on Streetwise Reports should not be considered a recommendation to buy or sell any security. Streetwise Reports does not endorse or recommend the business, products, services or securities of any company mentioned on Streetwise Reports.
3) From time to time, Streetwise Reports LLC and its directors, officers, employees or members of their families, as well as persons interviewed for articles and interviews on the site, may have a long or short position in securities mentioned. Directors, officers, employees or members of their immediate families are prohibited from making purchases and/or sales of those securities in the open market or otherwise from the time of the interview or the decision to write an article until three business days after the publication of the interview or article. The foregoing prohibition does not apply to articles that in substance only restate previously published company releases.
Charts and graphics provided by the author.
CliveMaund.com Disclosure:
The above represents the opinion and analysis of Mr Maund, based on data available to him, at the time of writing. Mr. Maund's opinions are his own, and are not a recommendation or an offer to buy or sell securities. Mr. Maund is an independent analyst who receives no compensation of any kind from any groups, individuals or corporations mentioned in his reports. As trading and investing in any financial markets may involve serious risk of loss, Mr. Maund recommends that you consult with a qualified investment advisor, one licensed by appropriate regulatory agencies in your legal jurisdiction and do your own due diligence and research when making any kind of a transaction with financial ramifications. Although a qualified and experienced stock market analyst, Clive Maund is not a Registered Securities Advisor. Therefore Mr. Maund's opinions on the market and stocks can only be construed as a solicitation to buy and sell securities when they are subject to the prior approval and endorsement of a Registered Securities Advisor operating in accordance with the appropriate regulations in your area of jurisdiction.