
This distinction is important because the gold price in recent years has been rising at a hyperbolic rate, which is illustrated in the following chart.
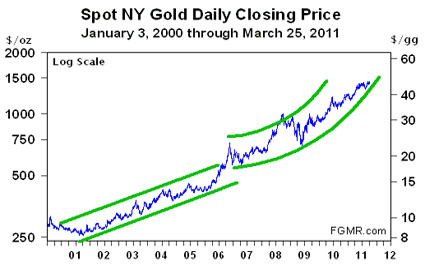
The above chart has been prepared on a log scale, so, for example, the distance between $250 and $500 is equal to the distance between $750 and $1,500. A chart prepared with an arithmetic scale does not accurately portray percent changes, while a log scale chart illustrates percentage changes perfectly, which is important. After all, if an asset you own doubles in price, it is this percentage gain that shows the relative increase in your wealth. In other words, if your asset doubles in price from $2 to $4, it is the same percentage gain as a double from $10 to $20, though obviously the absolute amounts may be different depending on the quantity of each asset you own.
From 2000 to about 2006, the gold price was confined within a linear uptrend channel, marked by the green parallel lines on the above chart. Thereafter, gold's pattern changed to what looks like a parabola but is actually a hyperbola because the above chart is prepared on a log scale.
This observation means that the gold price is rising at an accelerating rate; so, in my view, there is only one logical conclusion that can be made from this chart. Given that gold remains the world's numéraire by which things are measured because it is money, the other so-called 'money' being measured in the above chart—namely, the U.S. dollar—is losing purchasing power at an accelerating rate. In other words, we are rapidly approaching the hyperinflation of the U.S. dollar. In fact, the above chart illustrates that it has already begun. The dollar's hyperinflation will worsen if gold keeps climbing within the hyperbola on the above chart.
As if that were not scary enough, look at the following charts illustrating the rise in the price of gold against the British pound, euro and even the supposedly safe currency alternative—the Swiss franc. Gold is rising at a hyperbolic rate against all of them, suggesting that as the dollar moves along this present path to hyperinflation, these other currencies will hyperinflate along with it, which is logical given that (1) these currencies are backed by the world's reserve currency (i.e., the dollar) and (2) the central banks managing these currencies are 'printing' just like the Federal Reserve.
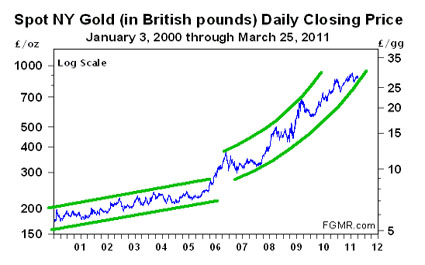
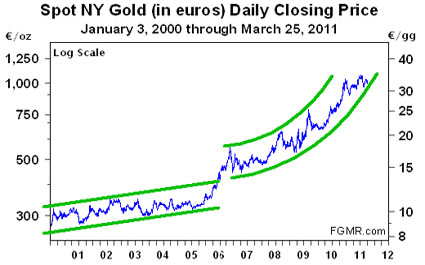
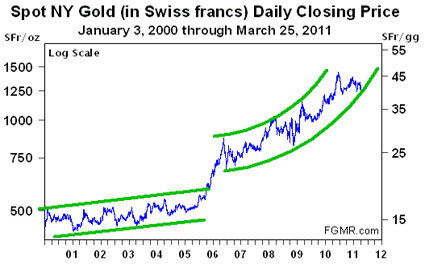
Given that the above charts show only weekly prices, and do so over many years, we cannot conclude that the final hyperinflationary blowoff will begin tomorrow, this week or next month. But we can conclude from the hyperbolic rise in the gold price that these currencies are on the path toward hyperinflation.
The never-ending debt issuance by the U.S. government that is accommodated by the Federal Reserve's policy of ongoing quantitative easing means that the dollar is being destroyed. Its purchasing power is being eroded because the Fed is turning too much of this debt into dollar currency, which is causing people to accumulate gold as a safe-haven alternative.
Significantly, the above charts show that the U.S. dollar's plight is not unique. Other national currencies are also being destroyed as their purchasing power erodes because of harmful central bank actions, and as one would naturally expect, the gold price is responding by rising against all of them. And gold's hyperbolic trajectory suggests that the hyperinflation of the dollar and these other currencies is imminent.
The above charts paint a very bullish picture for the gold price. It appears that the price is about to lift off from the base it has been forming over the past several months, which has consolidated the huge gains made by gold since the collapse of Lehman Brothers in September 2008. In other words, get ready for a moon-shot in the gold price and hyperinflation.
Gold's Hyperbolic Trajectory


