
That brings us to the "Definition Move" (DM) chart for silver.
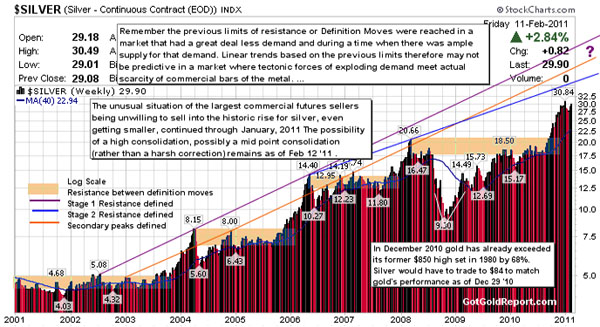
This particular DM looks completely different than the prior three; in those, the silver price advanced nearly parabolically toward the end of the advance, and then sold off immediately after the surge. We have yet to see a similarly harsh selloff in this current DM. Instead, silver seems to be high consolidating or staging as if in a midpoint consolidation. The former suggests a plateau, later advance or selloff. The latter suggests silver is pausing before continuing higher to define new high resistance.
The following shows important differences between this 2010–2011 DM and the three prior DMs:
- In the 2004 DM, the combined commercial traders were willing to take the short side of silver futures to as high as 91,212 contracts (456 Moz. in December 2004, or >75% of all contracts open).
- In the 2006 DM, the combined COMEX commercial traders were willing to take the short side of a net 87,195 contracts (436 Moz. peaking in December 2005 and >60% of all contracts open).
- In the 2008 DM, the big sellers were confident enough in lower silver prices to take the short side of up to 75,790 COMEX contracts (379 Moz. in February 2008, but then only a little >40% of the total open interest).


