
What a nutty week for the equities market! The bleeding has not let up with almost two weeks of straight selling. Also we are seeing oil break down with a rather large bear flag and if that happens, which it looks like it will. . .then hold on tight or cash out of the market!
There has been nothing but negative news for the past month and its not looking like there is much light at the end of the tunnel for a long time still. . .The only places which people feel some safety is in gold and silver. That being said the market is way over sold here and we could get a bounce lasting a couple days soon. But that bounce will be sold and pulled back down as it looks like a new bear market is starting.
Here are few charts of how I am seeing things in general.
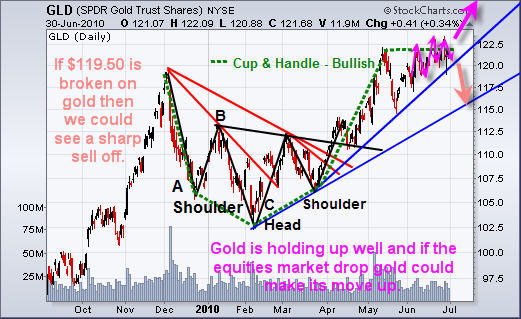
Gold ETF GLD—Daily Chart
Gold has formed a large cup & handle pattern. It has held up well during the recent weakness. But zooming into the intraday charts I do have some concerns about a sharp sell off in the very near future. We recently bought gold at $1226 and sold out between $1,255 and $1,260 a couple days later because it's not just screaming at me as a great buy. I am not a gold bug; I'm a trader who finds low risk opportunities, gets in and out with maximum profits and minimal drawdowns spending most of my time in cash. They way I see things is that there is always another trade just around the corner.
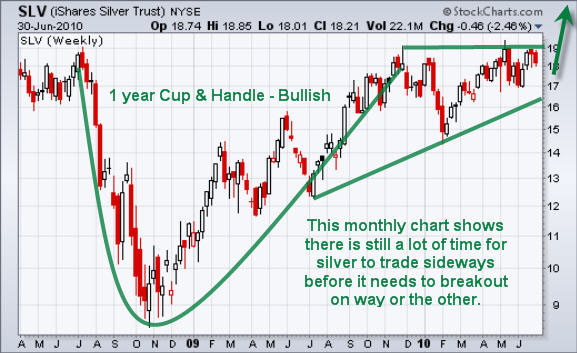
Silver ETF SLV—Weekly Chart
This is a weekly chart and goes all the way back to 2008 showing a very large cup and handle. Technically, we could still see silver trade sideways for several months before it reaches the apex and is forced to break out in either direction. The upside potential for a cup and handle pattern is 100%–300% of the height of the cup. So this means $1,450 gold and $29 silver using the minimum potential. Now you can see why so many people are buying precious metals. . .they want a big move. . .All that excitement and greed could catch up to them if we see a complete market meltdown again, which will pull EVERYTHING down with it—including gold and silver. This is one of the reasons I cashed out this week near the high.
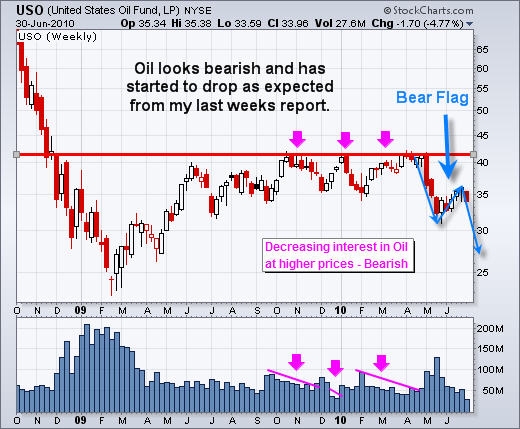
Crude Oil Fund—Weekly Chart
Oil formed a triple top over the past 10 months and has started to head south. We have seen selling volume drop during the test of resistance, which is not a good thing. A heavy selloff from resistance, as everyone bailed out of the investment, sent oil tumbling; and, just this week, oil started to break down from its bear flag. We are looking at USO to possibly drop to the $25–$27 area and oil to drop to the $60–$62 level over the coming two to three months.
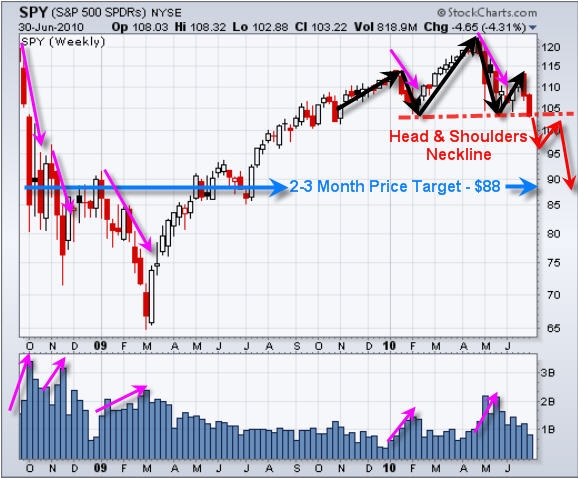
SP500 ETF SPY—Weekly Chart
The SP500 along with several other indexes have formed a head & shoulders patter and appear to be in the process of breaking down through the necklines. If this unfolds then we are looking at much lower prices for stocks. It is important to buy some protection on the down side or get into cash until the dust settles as we can always buy back in, but we cannot get back lost money as easily.
Mid-Week ETF Trading Conclusion:
In short, I really hate to be negative on the market and economic outlook. I know if the market crashes again, the majority of individuals who have worked hard, saved money and invested using mutual funds will lose most of their money in a fraction of the time it took to create the wealth. That is an uncomfortable thought, and there's nothing worse than just getting to retire and seeing half of your money vanish.
Anyway, the good news is that we can avoid these market crashes and actually take advantage of them using inverse ETFs, which go up 2x–3x faster than what the market is declining. These powerful trading tools, if used correctly, can make us a fortune while others are losing their shirts.
Currently, I am in cash and have taken a couple scalp short trades taking advantage of the market falling on Tuesday and again today. These trades only last about 10 minutes but generate some fast profits. You can see the short I did yesterday, which explains what I saw and when I put on the trade: http://www.futurestradingsignals.com/trading-education/es-mini-scalp-trade-video/.
On another note, tomorrow is Canada Day and I am Canadian, so. . .I will be done around 10:30am ET once the jobs numbers come out and the market trades for an hour in case there is a nice short or long trade for some quick money—eh!
If you would like to get my trading alerts please check out my websites at www.TheGoldAndOilGuy.com or www.FuturesTradingSignals.com.
Chris Vermeulen
There has been nothing but negative news for the past month and its not looking like there is much light at the end of the tunnel for a long time still. . .The only places which people feel some safety is in gold and silver. That being said the market is way over sold here and we could get a bounce lasting a couple days soon. But that bounce will be sold and pulled back down as it looks like a new bear market is starting.
Here are few charts of how I am seeing things in general.
Gold ETF GLD—Daily Chart
Gold has formed a large cup & handle pattern. It has held up well during the recent weakness. But zooming into the intraday charts I do have some concerns about a sharp sell off in the very near future. We recently bought gold at $1226 and sold out between $1,255 and $1,260 a couple days later because it's not just screaming at me as a great buy. I am not a gold bug; I'm a trader who finds low risk opportunities, gets in and out with maximum profits and minimal drawdowns spending most of my time in cash. They way I see things is that there is always another trade just around the corner.
Silver ETF SLV—Weekly Chart
This is a weekly chart and goes all the way back to 2008 showing a very large cup and handle. Technically, we could still see silver trade sideways for several months before it reaches the apex and is forced to break out in either direction. The upside potential for a cup and handle pattern is 100%–300% of the height of the cup. So this means $1,450 gold and $29 silver using the minimum potential. Now you can see why so many people are buying precious metals. . .they want a big move. . .All that excitement and greed could catch up to them if we see a complete market meltdown again, which will pull EVERYTHING down with it—including gold and silver. This is one of the reasons I cashed out this week near the high.
Crude Oil Fund—Weekly Chart
Oil formed a triple top over the past 10 months and has started to head south. We have seen selling volume drop during the test of resistance, which is not a good thing. A heavy selloff from resistance, as everyone bailed out of the investment, sent oil tumbling; and, just this week, oil started to break down from its bear flag. We are looking at USO to possibly drop to the $25–$27 area and oil to drop to the $60–$62 level over the coming two to three months.
SP500 ETF SPY—Weekly Chart
The SP500 along with several other indexes have formed a head & shoulders patter and appear to be in the process of breaking down through the necklines. If this unfolds then we are looking at much lower prices for stocks. It is important to buy some protection on the down side or get into cash until the dust settles as we can always buy back in, but we cannot get back lost money as easily.
Mid-Week ETF Trading Conclusion:
In short, I really hate to be negative on the market and economic outlook. I know if the market crashes again, the majority of individuals who have worked hard, saved money and invested using mutual funds will lose most of their money in a fraction of the time it took to create the wealth. That is an uncomfortable thought, and there's nothing worse than just getting to retire and seeing half of your money vanish.
Anyway, the good news is that we can avoid these market crashes and actually take advantage of them using inverse ETFs, which go up 2x–3x faster than what the market is declining. These powerful trading tools, if used correctly, can make us a fortune while others are losing their shirts.
Currently, I am in cash and have taken a couple scalp short trades taking advantage of the market falling on Tuesday and again today. These trades only last about 10 minutes but generate some fast profits. You can see the short I did yesterday, which explains what I saw and when I put on the trade: http://www.futurestradingsignals.com/trading-education/es-mini-scalp-trade-video/.
On another note, tomorrow is Canada Day and I am Canadian, so. . .I will be done around 10:30am ET once the jobs numbers come out and the market trades for an hour in case there is a nice short or long trade for some quick money—eh!
If you would like to get my trading alerts please check out my websites at www.TheGoldAndOilGuy.com or www.FuturesTradingSignals.com.
Chris Vermeulen


