
This triangular pattern is apparent on both the BUGS (HUI) and Philadelphia Gold and Silver (XAU) indices. I'm more bullish on the shares of the gold miners than gold itself, based on what I’ve seen on the 10 year GDX:$/GOLD chart. That's a ratio which compares the stock prices of the majors with gold futures.
Some good analysis of that came to me last week from Richard Rhodes of Rhodes Capital, courtesy of Chartwatchers.
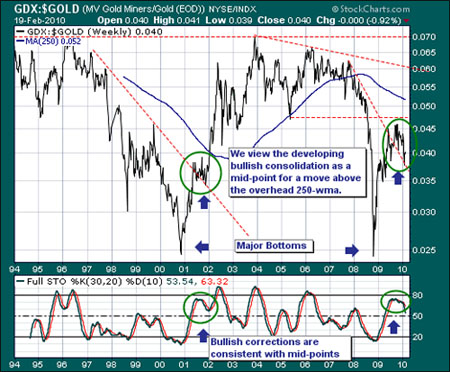
Richard notes a large trading range from top to bottom, with each level tested multiple times in sequence. Also, we've got two large, almost identical bottoms (2000 and 2008), which suggest the next move will be a repeat of what happened after 2001 when we hit that subsequent top. The full stochastic (bottom) shows that a bullish phase came in 2001 after hitting a midpoint, which is where we are now.


