
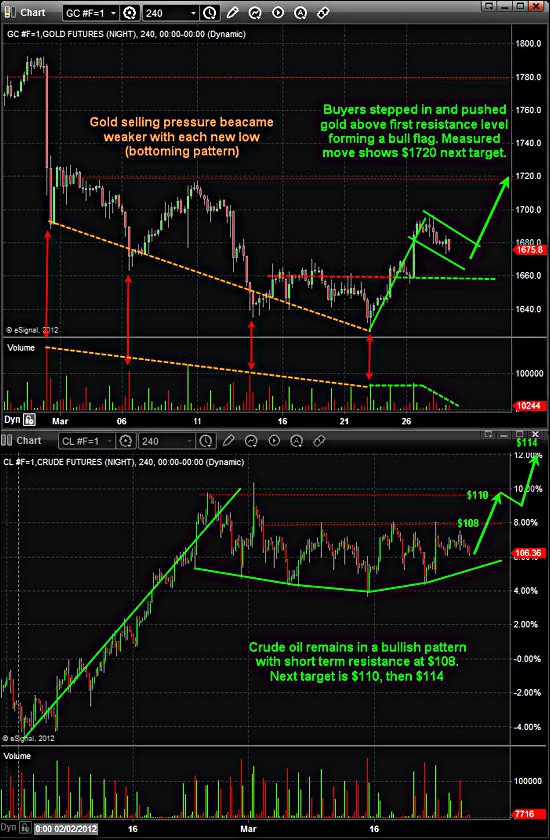
Below are the four-hour charts of gold futures and crude oil. Each candlestick is four hours, allowing us to look back 1–2 months while still being able to see all the intraday price action (pivot highs, pivot lows, strong volume spikes and if they were buyers or sellers. . .).
The four-hour chart is one timeframe most traders overlook, but from my experience I find it to be the best one for spotting day trades, momentum trades and swing trades that pack a powerful, quick punch.
As you can see below with the annotated charts, both gold and silver are setting up for higher prices in the next 1–2 weeks from a technical point of view. That being said we may see a couple of days of weakness first, before they start moving up again.
4-Hour Momentum Charts of Gold and Oil
Chris Vermeulen, www.GoldAndOilGuy.com


