
On Sept. 21, 2010, I published an article entitled More Forensic Evidence of Gold & Silver Price Manipulation, in which I showed how silver from 2003–2010 had never traded freely at all; it was algorithmically traded with gold with a very clear relationship between the prices of gold and silver.
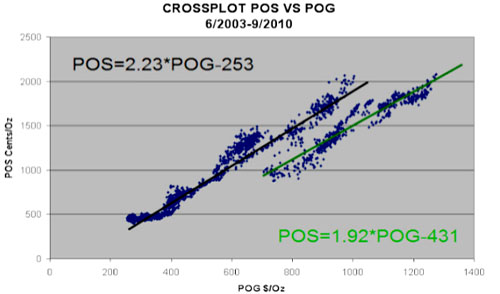
Figure 1 is a cross-plot of the gold price against the silver price for every trading day from June 2003–September 2010. There are two linear relationships—the first is pre-2008 (black line) and the second is post 2008 (green line).
The stunning revelation from the data analysis was that if, on any day, I knew what the price of gold was I would be able to calculate the silver price from the equation of the relationship! How is that possible in a free market? It simply is not possible and so the conclusion is that silver is not in a free market but is manipulated to move algorithmically with the price of gold.
I have updated the Figure 1 chart in Figure 2.
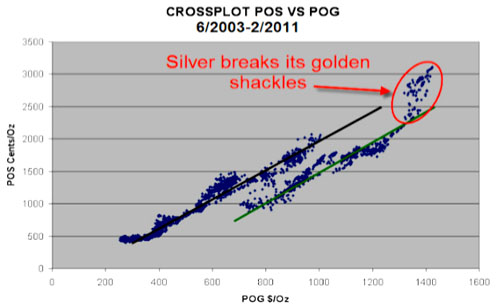
Since September 2010, silver has broken its golden shackles. The algorithmic trading that kept the silver price subdued for seven years has been annihilated.
On Friday, silver closed in complete backwardation on the Comex at $29.075/oz. February 2011 closed at $29.064/oz. and December 2015 closed at $29.026/oz. I believe this is the first time in history that this has happened. Silver traded in backwardation between the spot price and futures contract up to one year out during the blatantly manipulative precious metals bashing of January, but now the entire futures structure is in backwardation—a sure sign of silver shortages, as it means that buyers will pay a premium for silver delivered sooner rather than later.
Figure 1 is a cross-plot of the gold price against the silver price for every trading day from June 2003–September 2010. There are two linear relationships—the first is pre-2008 (black line) and the second is post 2008 (green line).
The stunning revelation from the data analysis was that if, on any day, I knew what the price of gold was I would be able to calculate the silver price from the equation of the relationship! How is that possible in a free market? It simply is not possible and so the conclusion is that silver is not in a free market but is manipulated to move algorithmically with the price of gold.
I have updated the Figure 1 chart in Figure 2.
Since September 2010, silver has broken its golden shackles. The algorithmic trading that kept the silver price subdued for seven years has been annihilated.
On Friday, silver closed in complete backwardation on the Comex at $29.075/oz. February 2011 closed at $29.064/oz. and December 2015 closed at $29.026/oz. I believe this is the first time in history that this has happened. Silver traded in backwardation between the spot price and futures contract up to one year out during the blatantly manipulative precious metals bashing of January, but now the entire futures structure is in backwardation—a sure sign of silver shortages, as it means that buyers will pay a premium for silver delivered sooner rather than later.


