
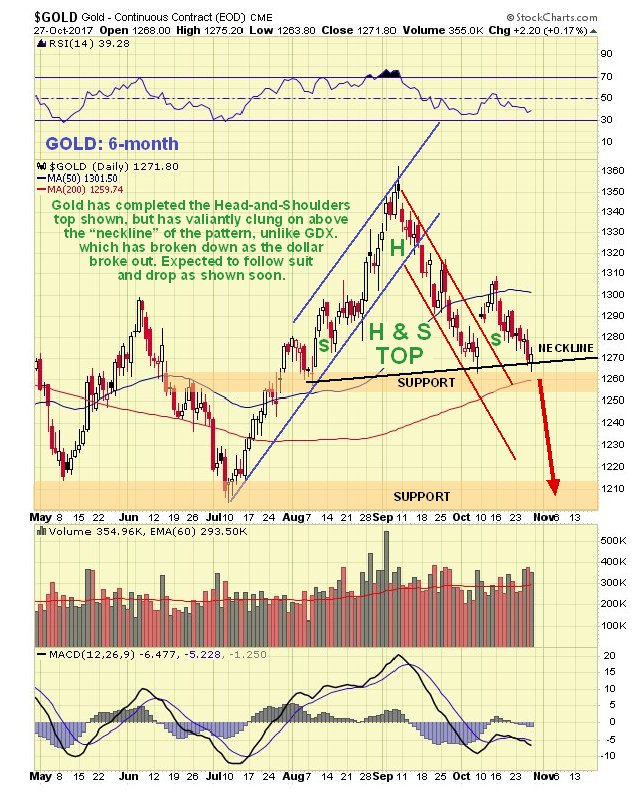
The big news last week for the Precious Metals sector was that the dollar broke out of its Head-and-Shoulders bottom to start its "Swan Song Rally," a development predicted in the last update, and for weeks before that. This caused PM sector stocks to break sharply lower, and brought gold to the point of breakdown from its Head-and-Shoulders top, as we can see on its latest 6-month chart shown below. It hasn't quite broken down yet, but is expected to follow stocks' lead and break down soon and head lower. Target is support in the $1200–$1215 zone, which is expected to be reached as the dollar index arrives at its upside target in the 97 area.
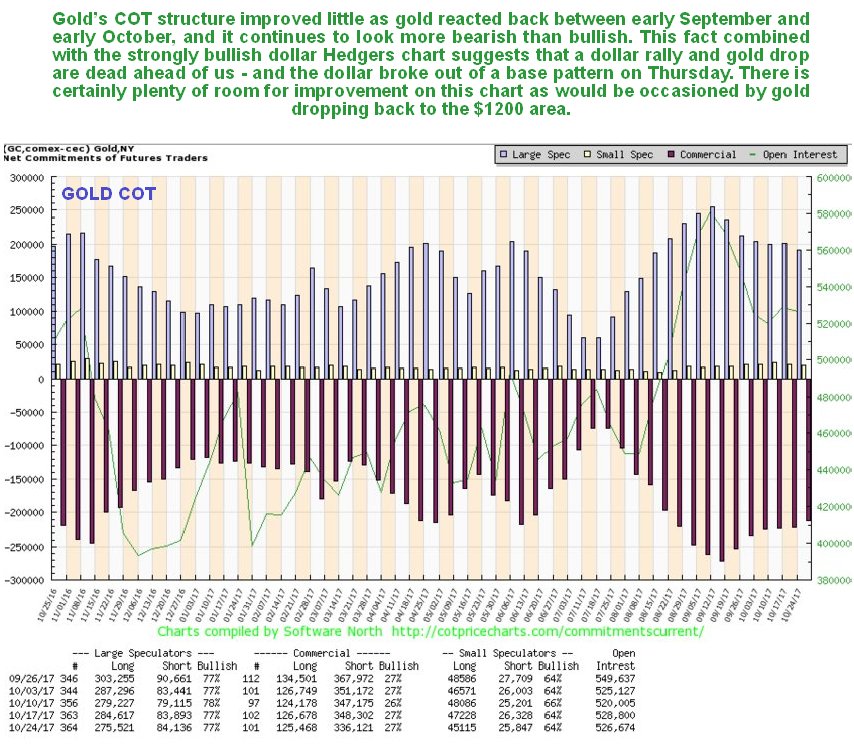
Gold's latest COT chart shows some improvement over the past week but still looks more bearish than bullish, with a lot of room for further improvement, such as would be occasioned by a drop to the $1200–$1215 area, which now looks imminent after last week's dollar breakout.
Click on chart to popup a larger, clearer version.
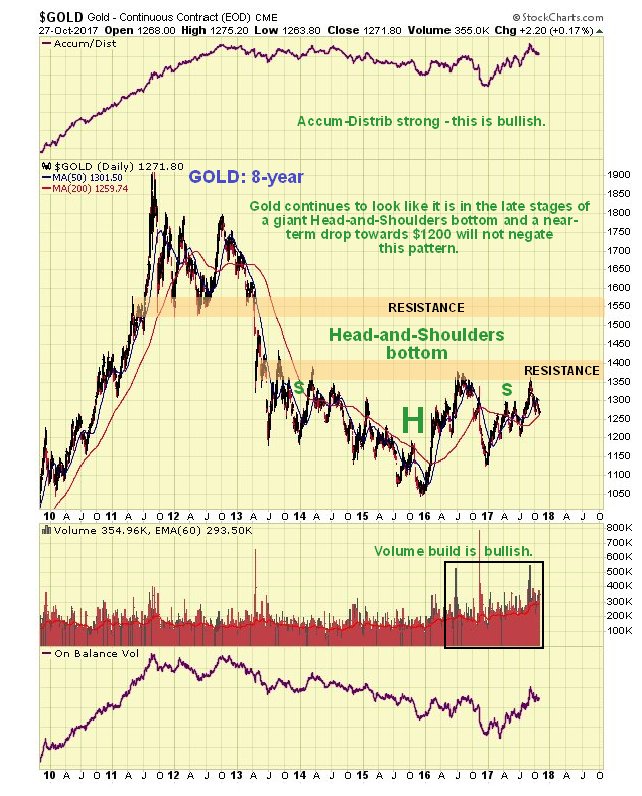
On gold's 8-year chart it continues to look like it is in the late stages of a giant Head-and-Shoulders bottom pattern. The buildup in volume over the past 20 months certainly looks positive, especially over the past several months, all the more so because it has driven volume indicators higher, notably the Accum-Distrib line, which is not far off making new highs—exceeding its level at the 2011 peak. Once gold breaks above the resistance level approaching $1400 it will be on its way, although it will then have to contend with another important band of resistance in the $1510–$1560 range. A near-term retreat by gold to the $1200–$1215 area in the face of a dollar rally will not damage this long-term technical picture.
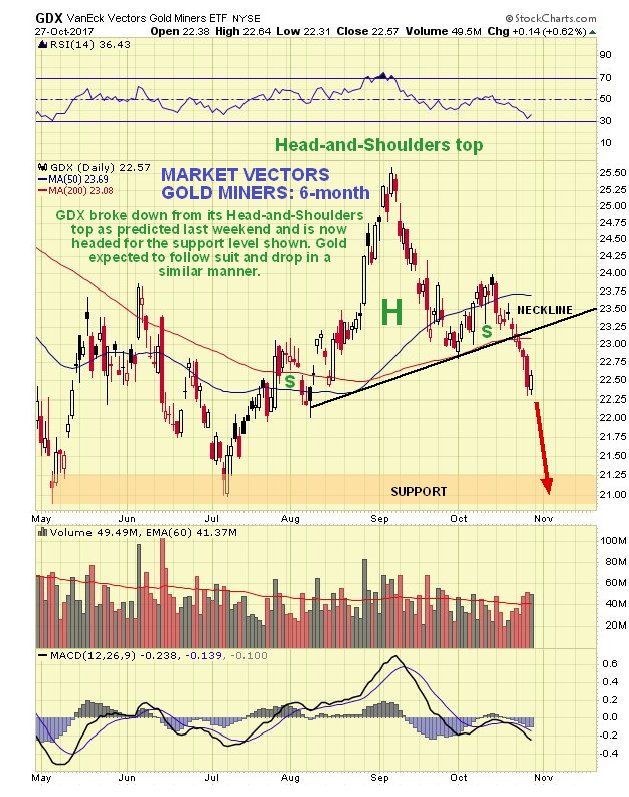
The Market Vectors Gold Miners, GDX, which functions as a gold stocks index, is marking out a giant Head-and-Shoulders bottom that roughly parallels the one completing in gold itself. A near-term decline to $20–$21 in GDX will be viewed as presenting another important buying opportunity for the sector. The volume pattern during the build out of this base pattern is very bullish, with big volume on the rise out of the low (Head) of the pattern, tailing off steadily as the Right Shoulder has formed.
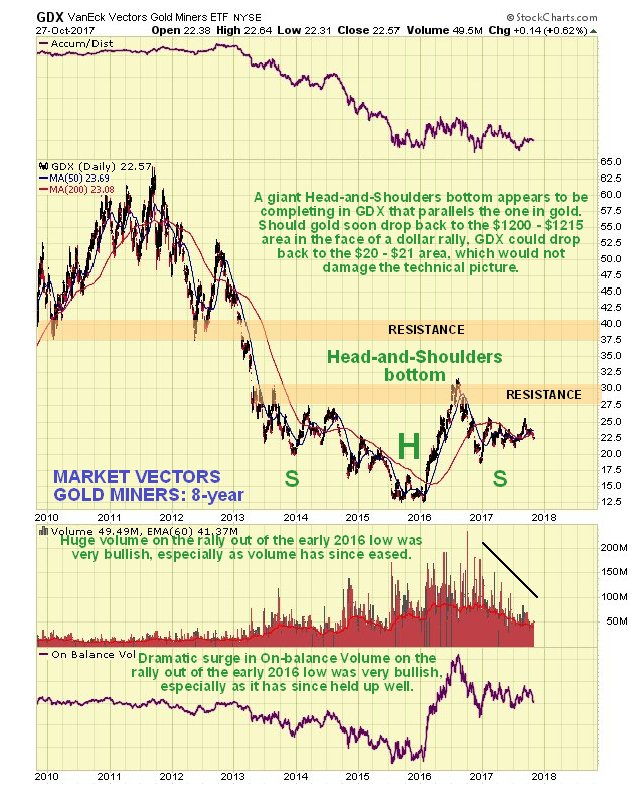
GDX broke down from its upsloping Head-and-Shoulders top last week, as predicted in last weekend's update, which actually occurred ahead of the dollar breakout. When the dollar did break out, it accelerated away to the downside, as we would expect. It is targeting the $21 area on the dollar index rally to the 97 zone and may go a little lower.
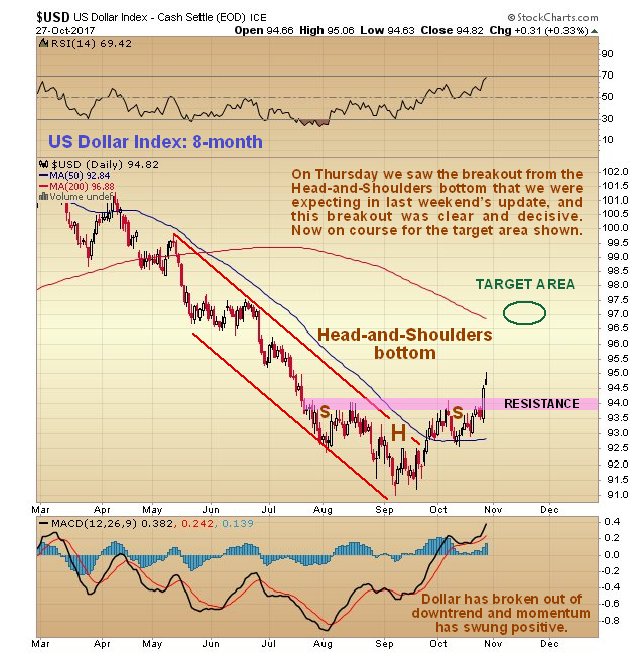
Turning to the dollar now, it staged a convincing breakout on Thursday from its Head-and-Shoulders bottom, a development we had been expecting for some considerable time, as can be seen on its latest 8-month chart below. Fundamental reasons for this appear to be a combination of a short period of mildly rising interest rates in the U.S. coupled with the possibility of a euro meltdown if Catalonia succeeds in becoming independent from Spain. A logical target for this "Swan Song Rally" is the 97 area on the index, where there is resistance near to the falling 200-day moving average. After reaching this target it should churn for a while and then drop away again.
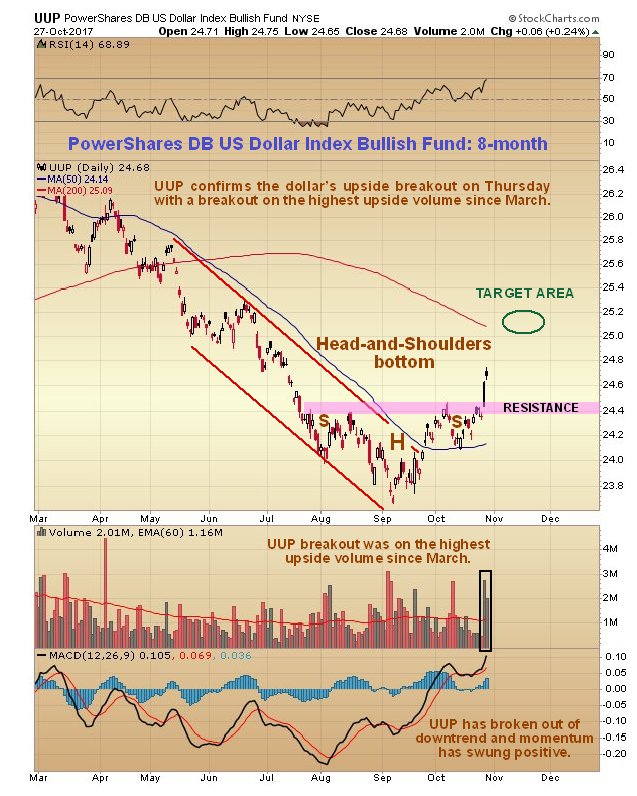
It is worth looking also at the 8-month chart for dollar proxy UUP,
because we can check the volume on Thursday's breakout, which aids in
assessing its validity. As we can see, volume was heavy on this
breakout, the highest upside volume for over six months, which is a strong
indication that the breakout was valid.
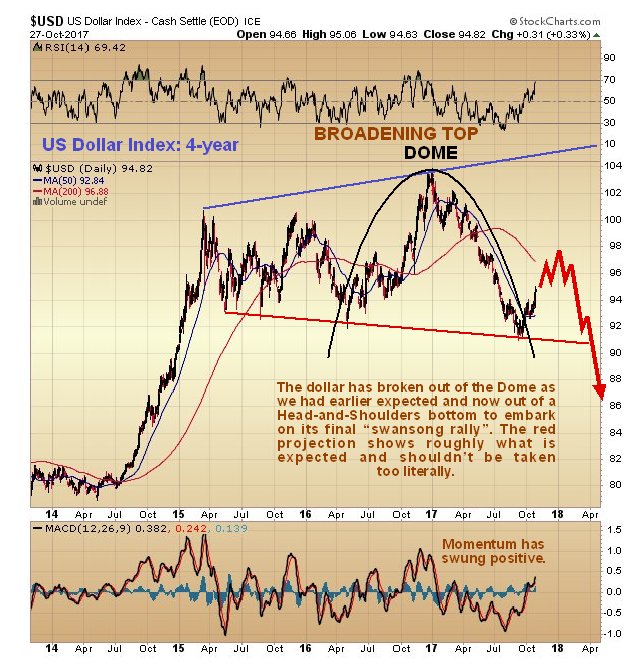
On the 4-year chart for the dollar index we can see how, after
contacting the lower boundary of a large Broadening Formation and
breaking out from the Dome that had earlier forced it lower, it has
started to trend higher again within the Broadening Formation, having
just broken out of the Head-and-Shoulders bottom that we looked at above
and that we can just make out on this chart. It is thought unlikely
that this this rally will get above the 97 area where there is
resistance, although there is some chance it could make it to the
mid-point of the pattern at about 99.
The Hedgers chart has been warning for weeks that the dollar will reverse and rally, as has been pointed out repeatedly. The latest chart shows that the rally just getting started with Hedgers positions at levels that have in the past led to significant rallies.
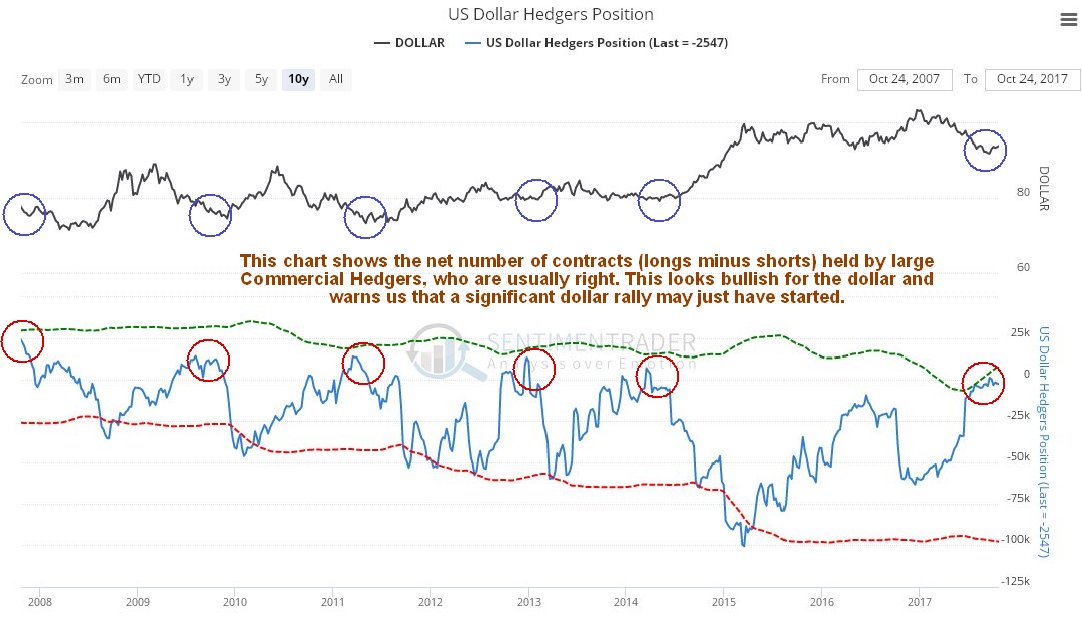
Click on chart to popup a larger, clearer version.
Chart courtesy of www.sentimentrader.com
Short- to medium-term outlook on gold down to $1200–$1215 area as dollar rally plays out, then turning up to break out of the giant base pattern shown on the 8-year chart above as the dollar rolls over and tips into a severe and possibly terminal bear market as the era of dollar dominance finally comes to an end.
Clive Maund has been president of www.clivemaund.com, a successful resource sector website, since its inception in 2003. He has 30 years' experience in technical analysis and has worked for banks, commodity brokers and stockbrokers in the City of London. He holds a Diploma in Technical Analysis from the UK Society of Technical Analysts.
Want to read more Gold Report articles like this? Sign up for our free e-newsletter, and you'll learn when new articles have been published. To see recent articles with industry analysts and commentators, visit our Streetwise Interviews page.
Disclosure:
1) Statements and opinions expressed are the opinions of Clive Maund and not of Streetwise Reports or its officers. Clive Maund is wholly responsible for the validity of the statements. Streetwise Reports was not involved in the content preparation. Clive Maund was not paid by Streetwise Reports LLC for this article. Streetwise Reports was not paid by the author to publish or syndicate this article.
2) This article does not constitute investment advice. Each reader is encouraged to consult with his or her individual financial professional and any action a reader takes as a result of information presented here is his or her own responsibility. By opening this page, each reader accepts and agrees to Streetwise Reports' terms of use and full legal disclaimer. This article is not a solicitation for investment. Streetwise Reports does not render general or specific investment advice and the information on Streetwise Reports should not be considered a recommendation to buy or sell any security. Streetwise Reports does not endorse or recommend the business, products, services or securities of any company mentioned on Streetwise Reports.
Charts provided by the author.


