
I've counted the months of correction since mid-April this year when I forecasted a top in the U.S. markets following a massive 13-month rally off the March 2009 lows. The theory I had at the time was that the percent of bulls in sentiment surveys was running at nearly 3:1 over bears. Of those surveyed, 57% were bullish in mid-April and only 20% were bearish. In addition, we had completed a clear 5-wave bullish pattern up from the March 2009 lows, and the time period of the rally was also a Fibonacci ratio.
Since that time, we have dropped to as low as 1011 on the SP500, which is a 38% Fibonacci intersection of the 2007 highs to 2009 lows, and also the 2009 lows to 2010 highs. This created a platform for a calendar year bottom, and since then we have marked some time rallying up to Fibonacci pivots and back down again.
The most recent action is what really caught my eye and my subscribers were made aware a few weeks ago to prepare for a rally. The drop from 1130 to 1040 on the SP500 was a "corrective pattern," meaning it was in a 3-wave formation—60 points down to 1070, 30 points up to 1100 and another 60 points down to 1040. This also lined up with the May 25th bottom and is yet another Fibonacci intersection. The rally up last week was extremely strong off the lows and, admittedly, probably caught some bears off guard and caused short covering, as well. What really woke me up as I did my research over the weekend were the sentiment surveys through last Tuesday.
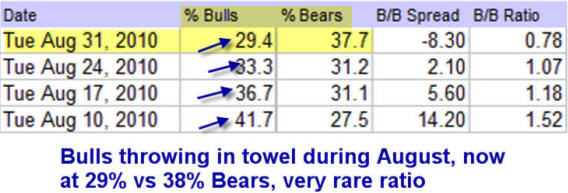
The percentage of bulls in the survey had dropped to 29%, while the bears had roared ahead to just over 37%. This is the first time the bears had been this high in the surveys in a very long time; in addition, the last time the bulls percentile readings were nearly this low was back in March of 2009, at 26%. Typically, these types of readings, when coupled with what I believe to be bottoming or "corrective" wave patterns, often lead to big rallies and catch people off guard. Conversely, overly bullish readings as in mid-April concomitant with certain Elliott Wave patterns I identify often also lead to tops.
What I expect now is a pullback to 1080, possibly 1070–1074 on the SP500, and then a large rally to roughly 1145. It will encounter some resistance there as it also is a 61.8% Fibonacci pivot of the 2010 highs and lows. The pendulum appears to be swinging back to the bulls and I expect, following the first full week of October, we will be rallying up past 1160 on the SP500, and then challenging the 1220 highs of April of this year.
A side note on gold and silver: I wrote a silver forecast last week with silver at $18.73/oz., predicting an imminent move above $19.50 with a breakout leading to $26–$29/oz. over several months. At this time, I favor silver over gold performance wise for the foreseeable future; and I still like gold moving to the $1300–$1325/oz. level in the coming months.
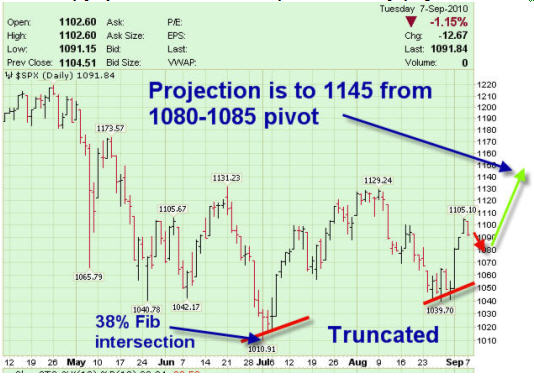
Below is my projected SP500 chart recently released to our paying subscribers at TMTF.
Please considering subscribing or enjoying our free weekly reports at www.MarketTrendForecast.com.
Since that time, we have dropped to as low as 1011 on the SP500, which is a 38% Fibonacci intersection of the 2007 highs to 2009 lows, and also the 2009 lows to 2010 highs. This created a platform for a calendar year bottom, and since then we have marked some time rallying up to Fibonacci pivots and back down again.
The most recent action is what really caught my eye and my subscribers were made aware a few weeks ago to prepare for a rally. The drop from 1130 to 1040 on the SP500 was a "corrective pattern," meaning it was in a 3-wave formation—60 points down to 1070, 30 points up to 1100 and another 60 points down to 1040. This also lined up with the May 25th bottom and is yet another Fibonacci intersection. The rally up last week was extremely strong off the lows and, admittedly, probably caught some bears off guard and caused short covering, as well. What really woke me up as I did my research over the weekend were the sentiment surveys through last Tuesday.
The percentage of bulls in the survey had dropped to 29%, while the bears had roared ahead to just over 37%. This is the first time the bears had been this high in the surveys in a very long time; in addition, the last time the bulls percentile readings were nearly this low was back in March of 2009, at 26%. Typically, these types of readings, when coupled with what I believe to be bottoming or "corrective" wave patterns, often lead to big rallies and catch people off guard. Conversely, overly bullish readings as in mid-April concomitant with certain Elliott Wave patterns I identify often also lead to tops.
What I expect now is a pullback to 1080, possibly 1070–1074 on the SP500, and then a large rally to roughly 1145. It will encounter some resistance there as it also is a 61.8% Fibonacci pivot of the 2010 highs and lows. The pendulum appears to be swinging back to the bulls and I expect, following the first full week of October, we will be rallying up past 1160 on the SP500, and then challenging the 1220 highs of April of this year.
A side note on gold and silver: I wrote a silver forecast last week with silver at $18.73/oz., predicting an imminent move above $19.50 with a breakout leading to $26–$29/oz. over several months. At this time, I favor silver over gold performance wise for the foreseeable future; and I still like gold moving to the $1300–$1325/oz. level in the coming months.
Below is my projected SP500 chart recently released to our paying subscribers at TMTF.
Please considering subscribing or enjoying our free weekly reports at www.MarketTrendForecast.com.


