
Gold Bull Market Forecast 2010—(1st Nov 09)
Gold has had a stellar run of late, which recently saw gold pushing to new all-time highs on a near daily basis, which has galvanized wider mainstream press attention to the precious metal with many gold bugs revising targets ever higher into loftier goals such as $2000 and even $4000+. Gold is one of the most popular asset classes both sought after by readers and written about by market commentators, and one of the most emailed query as to when will I update my original gold analysis of 22nd January 2009, which concluded during mid-2009; therefore this analysis seeks to project the gold price trend well into 2010.
Gold Price Forecast 2009 Evaluation
My original analysis for gold as of 22nd January 2009 concluded with a gold price trend higher into March 2009 towards a target of $960 to be followed by a subsequent decline into mid-2009 as illustrated by the original forecast graph below.
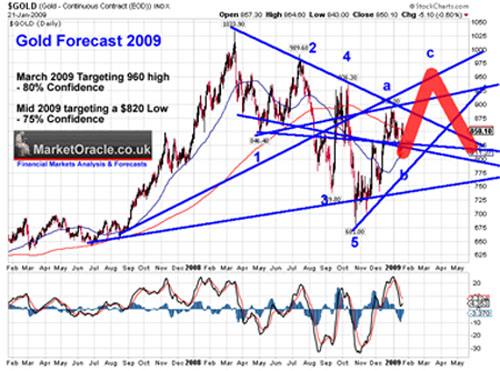
The gold price forecast proved to be accurate in terms of the projected impulse waves. This analysis seeks to project gold forward several months into 2010.
Fundamentals—Inflation Driving Gold?
The problem with this scenario is that the inflation of the 1980s and 1990s did NOT drive gold higher, so clearly the mantra of Inflation driving gold higher is not correct, especially as we are presently emerged in debt deleveraging deflation, and neither does discounting future inflation expectations hold up, as the gold bull market is now into its 10th year with a gain of 400% to date.
Gold Secular Bull Market
From 1980 to 1999 gold fell for 20 years, eventually it would bottom and embark on a bull market, eventually, the signs for this would be not in fundamental data, but contained within the price chart as gold breaks the pattern of corrective rallies followed by the downtrend resuming to new bear market lows. Now some 9 years later gold has corrected the preceding secular bear market by 50% in time and 100% in price. Therefore gold is not in a new bull market which has already contained many vicious bear markets within it as we witnessed last October, so just bear in mind that this is not a fresh young bull market, therefore much of the talk of waiting for public participation to join in can be discounted.
U.S. Dollar / Credit Crisis
My earlier analysis of a positive trend for the USD clearly implies given the inter market relationship between a two for a weaker trend for gold. However the risk is that amidst the next phase of the global financial crisis as the bankrupt banks have far from recovered, the next stage of the banking crisis accompanied by recognized inflationary panic measures of money printing which devalues all fiat currencies could give a lift to gold.
Quantitative Easing aka Money Printing Hedging
We are in a new world (for the west anyway) and that is a world of Quantitative Easing, the more the governments of the world print money and monetize debt the easier it is for governments to keep printing and monetizing ever escalating amounts of government debt to cover the government budget deficit gap. What this means is collective currency devaluation where relatively speaking there appears to be little change but in real terms the flood of money has to be seen in rising commodity prices and other scarce resources, after all the supply of resources is mostly known and the population of the world is not decreasing so the demand is known to be on an upward curve. Therefore as long as the central bankers are embarked on the experiment of quantitative easing that should give a lift to gold and other commodities as it increases inflation expectations and therefore inflation hedging using gold and more liquid commodities such as crude oil.
Gold Technical Analysis
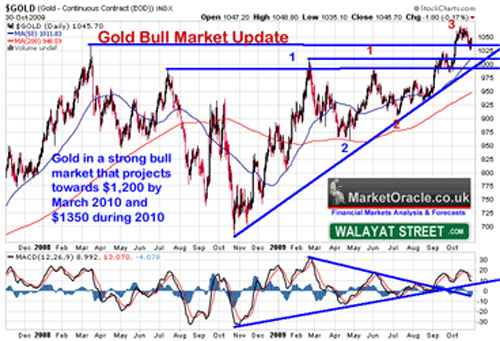
ELLIOTT WAVE THEORY—The Elliott wave pattern implies we are a strong bull market that has much further to run, i.e. in Wave 4 of a larger Wave 2 advance. This also suggests that the immediate future should see further weakness in gold towards $1,000. However, this is just a correction in the trend that projects to a price of more than $1,100 by the end of this year, with the trend continuing into March 2010 toward $1,200 before a more serious correction takes place.
TREND ANALYSIS—Gold's breakout to a new all-time high is a clear signal of further strong advances. The support trendline is at $1,000 and therefore fits in nicely with the Elliott wave correction projection target. After the uptrend resumes this trendline is unlikely to be revisited until the second quarter of 2010.
SUPPORT / RESISTANCE—Resistance lies at the last high of $1071, Immediate support lies across the string of previous highs of $1033 and $1007, therefore there is very heavy support whilst very light resistance overhead, which again is suggestive of a mild correction in the current phase of the trend.
PRICE TARGETS—The measuring move off of the $681 2008 low projects all the way to $1,350, which looks set to be an achievable price during 2010. Nearer term immediate targets extend to $1,100 then $1,200.
MACD—The MACD indicator signaled a gold breakout at $960, with a firm established uptrend. The current correction is in line with that of a mild correction within a strong uptrend.
SEASONAL TREND—There is a strong seasonal tendency for gold to rally from November through January i.e. for the next 3 months. This is suggestive that the current correction is living on borrowed time and may not last much longer
Gold Conclusion (1st Nov 09)
I started off this analysis skeptical of the prospects for gold given the 10 year bull run to date, but the price that is talking off the charts is pretty bullish! enough for me to consider accumulating a position. In the immediate future gold appears to be targeting a continuing correction towards $1,000, after which it targets $1,200 by March 2010 and a price of $1,350 later during 2010.
Gold Long-Term—Gold has broken out to a new high and it does look as though it is going much higher in the long run, there are multiple measuring moves that one can consider, such as 133%, 150%, 1.618% etc. However given the gap in time between the all-time peaks, gold of $2000 plus would now not surprise me.
Gold Update—30th Jan 2010
The gold bull market remains intact which is supported by strong fundamentals of record high investment demand coupled with shrinking mine production. I expect the gold bull market to run for several more years. and as with all scarce resources / commodities, the price of gold is bring driven higher by increasingly out of control money printing and huge deficit spending feeding the inflationary mega-trend i.e. ultimately money printing just increases the supply of money which will eventually force prices ever higher as the increased fiat money exchanges hands for what remains a limited commercial and investment resources.
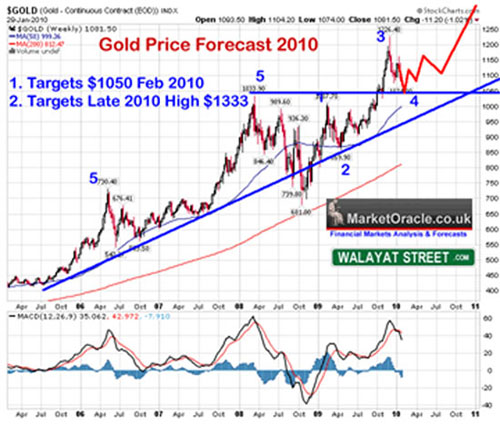
GOLD Elliot Wave ABC Correction—The recent Peak in the gold price at 1225 can be interpreted as a Wave 3 that suggests gold is undergoing a relatively minor ABC correction that extends towards a target of $1050 i.e. along the previous resistance area. gold presently has completed Waves A and B, with the C wave well underway which suggests that the target could be reached by mid-February.
GOLD Mega-Trend—Those that are looking for a FINAL peak in the gold price will be greatly disappointed because gold will NEVER peak, yes it will experience cyclical bear markets (buying opportunities), especially after powerful bull runs but as long as the world's central banks continue to debase their currencies then the upward inflationary spiral in the gold price, as with virtually all commodities is an inevitable mega-trend for the duration of human civilization, which is based on the premise that a. The world's population will continue to increase, and b. That technological alchemy that is able to produce new 'cheap' gold will remain out of reach for at least another 50 years.
GOLD—Dollar Relationship—There does exist an important dollar / gold inverse relationship which given that my analysis projects towards USD 84 during the first half of 2010 suggests that gold will find it difficult to break above the $1225 high during this time period.
GOLD Technical Analysis—After the gold correction bottoms at the target of $1050 or lower, gold will initially target the former $1225 peak and then 1.618% of the swing from $1225 to $1050 (anticipated low), which projects towards an 2010 target of $1,333, which amazingly is precisely in line with my 1st November 2009 target of $1350.
Furthermore, a trendline extending through the current correction illustrates a probable trend path around which gold can expect to gyrate towards its target of $1333 by late 2010, and continue further on into 2011 as the gold price continues to look set to trend towards $2,000 which should be easily achievable within the next 3 years.
GOLD Seasonal Trend—The seasonal tendency is for gold to trend lower from a Jan / Feb peak to a July / August Low, which is then usually followed by a trend higher into Jan / Feb of the following year.
Gold Price Forecast Conclusion
The two key conclusions are:
- That the current correction is targeting $1050 to be achieved during February 2010
- That gold is targeting an Impulse Wave 5 into late 2010 peak of at least $1,333, which remains as per the original forecast of 1st November 2009.
Gold Beyond $1,333
As mentioned earlier, $1,333 is just a target for 2010, the gold price may even reach as high as $1,400 this year, en route towards my longer-term target of $2,000, which would basically represent a 85% gain on the current price of $1,081 and much more so when gold stocks are brought into the equation though there trends are also subject to that of the general stock market.
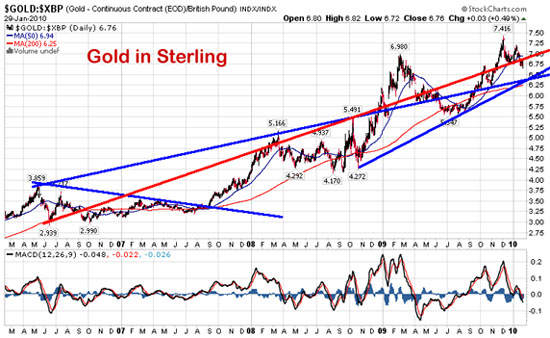
Gold Trend in Sterling
Gold price in Sterling is showing a similar trend pattern and price expectation of the current correction having a little further to run before gold hits its major support trendlines as indicated on the below graph. Therefore currency movements have only marginal impact on the trend as the gold price volatility is far greater than the expectations that the British Pound will fall by approx 10% over the next 12 months. Still this 10% will further extend gains for sterling on top of that forecast for the gold in dollars.
GOLD UPDATE 18th Feb 2010
Gold bounced from the $1,050 target low and hit the resistance area of $1,125 and currently retracing a little to $1,115. The anticipated pattern of behavior as per the forecast suggests gold should now take some time to form a higher bottom at between $1,075 and $1,100 before breaking resistance at $1,125. So a break of $1,125 now would show relative strength in terms of the forecast. Though even after $1,125 breaks, the gold price trend is still expected to take some time to break to a new high, i.e. probably not before the fourth quarter of 2010, so still suggesting range trading price action between the last high of $1,226 and the low of $1,050.
It also should be noted that over the past week, gold, Stocks AND the dollar have been showing strength, weren't we repeatedly told that cannot happen?
This analysis is part of New Inflation Mega-Trend ebook, To receive the ebook for FREE as well as updates throughout the year ensure you are subscribed to my always free newsletter.
Nadeem Walayat
www.marketoracle.co.uk
Copyright © 2005–10 www.marketoracle.co.uk (Market Oracle Ltd). All rights reserved.
Nadeem Walayat has over 20 years experience of trading derivatives, portfolio management and analyzing the financial markets, including one of few who both anticipated and beat the 1987 crash. Nadeem's forward looking analysis specializes on UK inflation, economy, interest rates and the housing market and he is the author of the NEW Inflation Mega-Trend ebook that can be downloaded for free. Nadeem is the editor of The Market Oracle, a FREE Daily Financial Markets Analysis & Forecasting online publication. We present in-depth analysis from over 500 experienced analysts on a range of views of the probable direction of the financial markets. Thus enabling our readers to arrive at an informed opinion on future market direction. www.marketoracle.co.uk
Disclaimer: The above is a matter of opinion provided for general information purposes only and is not intended as investment advice. Information and analysis above are derived from sources and utilizing methods believed to be reliable, but we cannot accept responsibility for any trading losses you may incur as a result of this analysis. Individuals should consult with their personal financial advisors before engaging in any trading activities.


