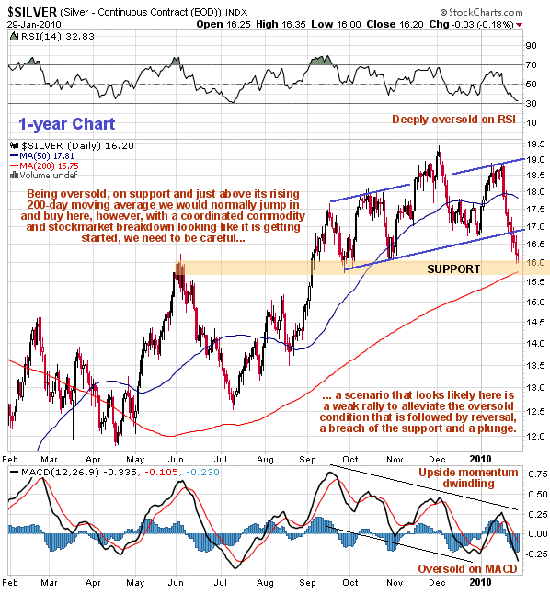
Although the big picture for most markets, including the Precious Metals market, is rapidly worsening, it is clear on our 1-year chart for silver that it is now deeply oversold, as it has plunged from about $18.80 to $16.20 in under two weeks. Given that it has now arrived at a support level that is just above its rising 200-day moving, a short-term bounce looks likely that will serve to alleviate the oversold condition before it probably goes on to crash this support. Such a bounce is unlikely to get very far given the overall bearish tenor of most commodity charts, and a likely target for it would be the $16.80 - $17.00 area. If silver does rise to this area we may short it, depending on how it looks when it gets there, and will certainly consider shorting weaker silver stocks.

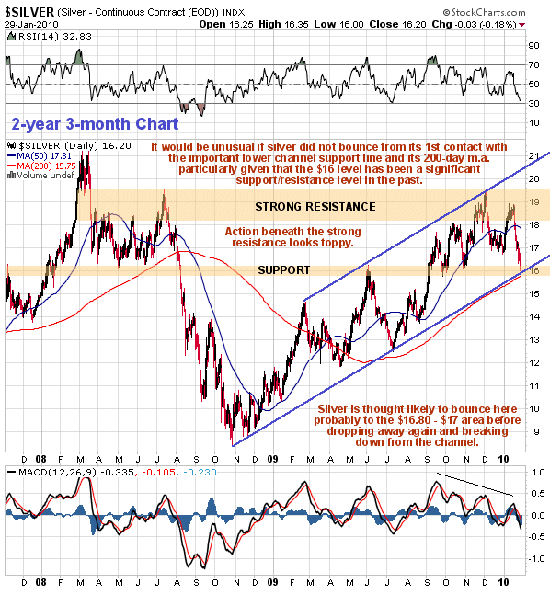
On the 2-year 3-month chart (this timeframe having been chosen to stop the March 2008 peak area being obscured by data), silver appears to be in a fine parallel uptrend channel and to be a buy following the reaction to the lower channel support line. However, it is the bearish behavior of other markets combined with the toppy looking action beneath the strong resistance shown on this chart that leads us to the conclusion that it is probably destined to break down, although for the reasons outlined above it should bounce before the expected breakdown occurs.


