
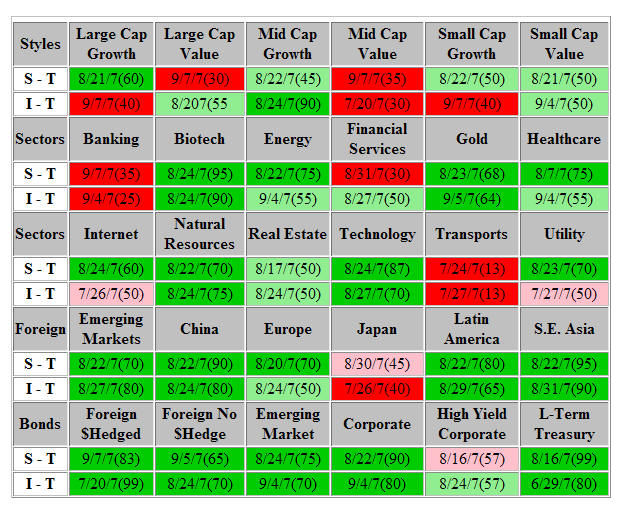
The table below includes both Short Term (S - T) and Intermediate Term (I - T) Rating results of our technical analysis of the price direction for the Styles and Sectors we follow. The intention is to give you insight into the time frames that are involved in our portfolio management process. Short Term ratings capture more of the wiggles in the market while the Intermediate Term ratings capture more of the trending aspects of the market. If we are in a period where the market is in a trading range with little trend direction, the Short Term ratings are more useful. On the other hand, if the market is in a longer term trending mode, we put more emphasis on the Intermediate Term Rating results. Note that signals can change in between reporting periods which may be confusing at times. For example, a Green light may have changed to Red and back to Green since the last report. The Rating Table would still be Green but the signal date would have changed from that shown on the prevous report..
Last week was a down week pretty much across the board. The action last week and the YTD performance for key market indices were as follows: DJIA - 1.83% / + 5.2%, S&P500 - 1.39% / + 2.5%, NASDAQ Composite - 1.18% / 6.2%, S&P400 Mid Cap - 1.11% / 6.1% and Russell 2000 Small Cap - 2.15 / - 1.5%. Of course, it was Friday’s sharp decline that put the week in deficit mode. That decline was triggered by the sharp decline in job growth for the month of August and downward revisions for both July and June. I am not one of those that says that the housing/mortgage problem is not a a big deal and that global growth will automatically keep the U.S. economy perking along. I think it is potentially a serious problem (along with some others like excess leverage and mountains of complex derivatives, etc.) that goes far beyond just the sub-prime mortgage situation.
I believe that the Fed fears deflation much more than they do inflation and will battle deflation with the conventional tools that ultimately promote inflation: lower interest rates, plenty of liquidity and 'easier' credit. Those are the only tools that they have outside of jawboning. The key, in my opinion, is to keep the defaults to the borrowers that really shouldn’t have had loans in the first place, but not let it spread to those that could likely make it through the ‘valley’ with somewhat lower interest rates for their pending ARMs rate adjustments and/or payments on Equity Lines of credit. For new borrowers, credit qualification criteria need to return to more traditional terms, or the credit bubble will just inflate again.
Speaking of liquidity! The M2 and MZM numbers reported for the week of 8/27/07 are roaring again. The year-over-year four week average of MZM shot up to 15.3%. That was even higher than the peak in April of 15.1%. The seasonally adjusted weekly MZM number for the week ending 8/27/07 was 7841.8 billion as compared to the 7627.4 billion number for 7/30/07. That is a jump of 2.81% in one month or an annualized jump of 33.72%. The seasonally adjusted number for M2 on 8/27/07 was 7400.0 billion compared to the 7/30/07 number of 7284.7 billion. That corresponds to a 1.58% increase over the past four weeks or an annualized rate of 18.96%. What is also interesting is that the raw MZM number was 7781.0 billion compared to 7540.3 billion on 7/30/07. That is a one month infusion of 240.7 billion or 3.19%. That is an annualized rate of 38.28%.
Early last Fall there was a big surge in the monetary growth numbers and the stock market subsequently soared through the end of the year, and ignored the seasonally Fall correction period. After a reduction in monetary growth in the January/February period the market had a short term drop in late February to early March. Then the monetary growth numbers surged again with a peak in MZM year-over-year growth of 15.1% in mid April. The stock market surged again till a peak in mid July. However from mid-April through July the monetary growth was essentially flat. Subsequently, the market tumbled to a low in mid-August. However, since the beginning of August, monetary growth has surged again. Does this portend another surge in the stock market through the end of the year? Let’s see what unfolds, and respond accordingly.
Another drop in the Federal Discount rate or the Federal Funds rate, or both, on September 18th or sooner, coupled with continued spurts in M2 and MZM, as described above, would signal that the anti-deflation battle is on with abandon. As a Navy Captain in the Civil War is reported to have said long ago, “Darn the torpedoes (inflation), full speed ahead”. In reality, the Fed doesn’t have any better alternatives, in my opinion. Let’s see if the stock market and the economy respond positively on cue again. If they don’t, then more defense in our investment strategies will be in order. The Fed has an important role to play and will do its best, but it is not omnipotent. We are watching closely with one eye on our Rating Table (stock market action) and one eye on the Fed.
John Hussman, (www.hussmanfunds.com) has another viewpoint of the Federal Reserve and its powers that he discussed in his report “Why the Fed is Irrelevant”. Nevertheless, perception is often more powerful that the reality. The financial markets perceive that the Fed has power, whether it does or not may be academically irrelevant.
Industrial Sectors
Biotech, Gold Mining, Natural Resources and Technology are on double Green lights. Banking and Transportation are on double Red lights. That seems to be a pretty good commentary on the current state of the economy. As I have mentioned in previous reports, the Transportation index is often a forecaster of economic activity. Nevertheless, there is still a greenish hue to most of the Industrial sectors.
The big news last week was that Gold bullion closed over $700. The XAU Gold Mining index was up 7.6% last week, bringing the YTD gain to 6.5%. Hey, that is more than the DJIA’s 5.2% so far this year. I think the Gold and currency markets also see the increase in M2 and MZM that I noted earlier.
Energy/Defense/Resources Plus - EDRP: We initiated a new Agricultural Resource position during the week. The precautionary Small Cap Bear hedge that was added prior to the Labor Day holiday was removed early in week. The current sub-sector allocations for the EDRP portfolio are 5% Energy Services, 16% Energy Exploration & Production, 5% Alternative Energy, 14% Defense-Major, 7% Defense-Components, 6% Security Systems, 17.5% Precious Metals, 8% Natural Resources and 1% Agricultural Resources. The net market exposure is 79.5% with Money Market reserves of 20.5%.
Natural Resource Plus - NRP: The precautionary Small Cap Bear hedge that was added prior to the Labor Day holiday was removed early in week. The current allocations are 8% Gold Bullion, 27.5% Precious Metals Mining, 12.5% Energy Exploration and Production and 18% Natural Resources. Net market exposure is currently 66% with Money Market Reserves at about 34%.
Gold Portfolio - GLD: We added to the Precious Metals allocation again last week. The Gold Mining sector generated a Short Term Green light on 8/23/07. The big news last week was that Gold bullion closed over $700. The XAU Gold Mining index was up 8.6% last week, bringing the YTD gain to 6.5%. Hey, that is more than the DJIA’s 5.2% so far this year. I think the Gold and currency markets also see the increase in M2 and MZM that I noted earlier. Nevertheless, the Gold Mining sector is likely overextended on a Short Term basis, so a give back of half of last week surge would not be a surprise. That would be a pullback of 4.3% for the XAU. Also, the recent bullish action has put the XAU at the top end of the trading range in force since May, 2006. The current allocation is a 15% gold bullion position and 70% precious metals mining securities, which includes a 10% specific silver mining allocation. Money Market reserves are about 15%.
Tactical Asset Allocation Style & Sector Signals:
Ratings 60% and Above are a Green Light
Ratings 40% and Below are a Red Light
Ratings 41% to 59% are Neutral
Light Green indicates going from Green to Neutral since last Signal Date
Pink indicates going from Red to Neutral since last Signal Date
This is a reduced version of Ron Miller's Tactical Asset Allocation Style & Sector Signals table. Ron's portfolio management process includes the technical analysis of over 400 mutual funds that have been selected to represent forty four different styles and sectors that are tracked daily for both Short Term and Intermediate Term direction signals. These include the 9 Morningstar portfolio management style boxes plus 16 equity sectors, 10 international styles/sectors and 9 bond sectors. Ratings are based on the percentage of securities followed in each category that are on buy signals. Short Term (S - T) signals are based on daily price data and may be different and change more frequently than the Intermediate Term (I - T) signals that are based on price action for a trailing 5 day period. These ratings are subject to change at any time and obviously their accuracy is not guaranteed. Individual securities may perform differently from these signals. These direction signals are a useful tool in the portfolio management process but are not the sole determinate of actual portfolio style or sector weightings. They should not be interpreted as a buy or sell recommendation for any specific financial securities and do not reflect positions of Morgan Keegan. Market data used in this analysis is believed to be from reliable sources but its accuracy can not be guaranteed. Past performance is not indicative of future results.
Portfolio Action Update Explanation: I try to confine my comments to a discussion of what recent action has occurred in these portfolios and my current technical analysis posture. In general, my portfolio management approach is to determine current market conditions through technical analysis and to position the various portfolios strategies to participate in the current environment. Although I usually have an opinion of the future direction of the market, I don’t rely heavily on my opinion in the portfolio management process. Neither opinions, technical analysis or fundamental security analysis produce perfect results. There is always a degree of risk present.
These comments will usually be written on the Weekend. However, a few days may transpire from when they are written and when they are posted on the web site. Obviously, the technical analysis signals and portfolio positions could have changed in that timeframe. Therefore, this technical information and related comments should only be read from a historical perspective, and may not reflect what the current analysis and portfolio positions actually are when you read this update. You can call us for the most current update if you wish.
Although the Technical Analysis Ratings illustrated in the table below are a very useful tool in our portfolio management process, these ratings are not the sole determinate of the asset allocation positions held in our various portfolio management strategies. This information is not intended to be a solicitation of a buy or sell of any financial security. The opinions expressed herein are my own and do not reflect the position of Morgan Keegan & Co., Inc. Past performance is not a guarantee of future results.


