
The future ain't what it used to be.—Yogi Berra
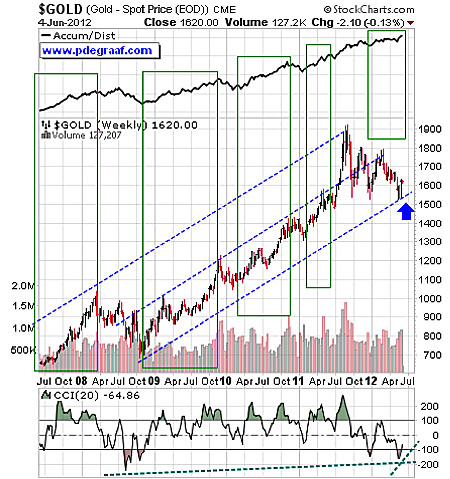
This weekly chart, courtesy of Stockcharts.com, features the gold price rising within the blue channel and the accumulation/distribution line at the top. The green boxes show the historical connection between the gold price and the A/D line. Whenever the A/D line rises (as now), price usually follows. The fact that the A/D line has been moving up since the beginning of 2012 puts pressure on the gold price to "get in step."
There can be no other criterion, no other standard than gold. Yes, gold, which never changes, which can be turned into ingots bars, coins, which has no nationality and which is eternally and universally accepted as the unalterable fiduciary value par excellence—Charles de Gaulle
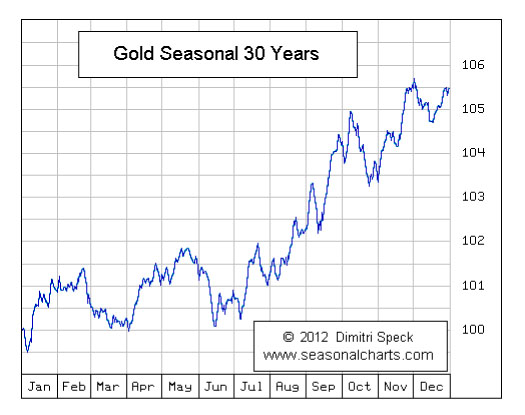
Chart courtesy Dimitri Speck.
It shows the seasonal tendencies for gold based on data going back to 1982. Quite often the gold price produces a low in June and rises from then into February.
The budget should be balanced, the treasury should be refilled, public debt should be reduced, the arrogance of officialdom should be tempered and controlled, and the assistance to foreign lands should be curtailed lest Rome become bankrupt. People must again learn to work, instead of living on public assistance.—Cicero (55 BC)
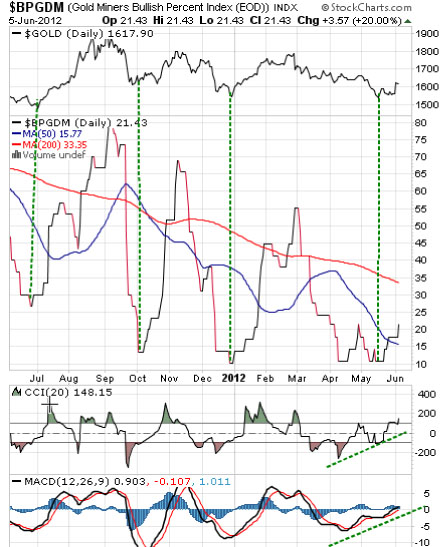
Featured is the Bullish Percentage Index based on the Gold Miners Index ($GDM at Stockcharts), with the gold price at the top. Historically whenever this index turns up from below 30, it is matched by a rise in the price of gold that lasts several months.
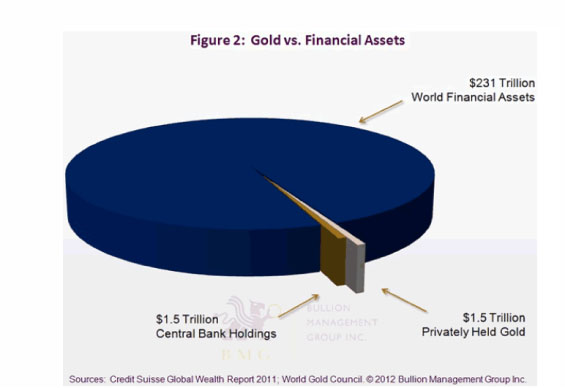
This pie chart is courtesy Bullion Management Group Inc. It shows shows gold to be a tiny part of the world's investment holdings. The potential for investors to switch from other investment vehicles into gold is tremendous.
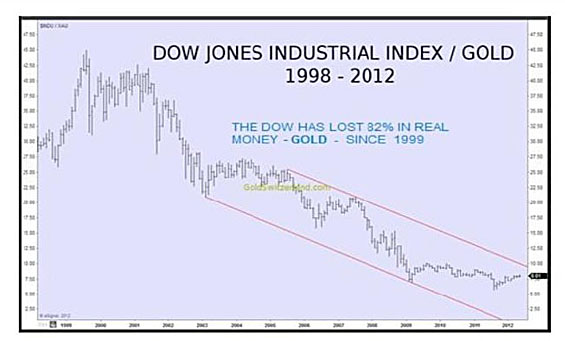
This chart, courtesy ofGoldswitzerland.com, shows the Dow Jones Industrial Average expressed in "real money"—gold.
The real cost of the state is the prosperity we do not see, the jobs that don't exist, the technologies to which we do not have access, the businesses that do not come into existence, and the bright future that is stolen from us. The state has looted us just as surely as a robber who enters our home at night and steals all that we love.—Frederic Bastiat
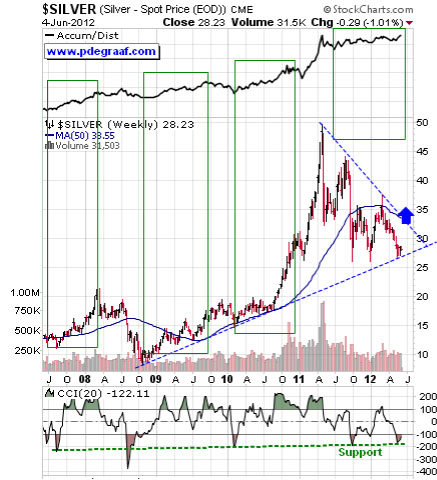
Featured is the weekly silver chart, courtesy of Stockcharts.com. Silver is noted for the large pennants that are produced time after time. One such pennant is being carved out at the present time. At the top of the chart is the accumulation/distribution (A/D) line. Historically whenever the A/D line rises, it pulls price up with it. For the past few months the A/D line has risen and silver has not yet followed. Unless one expects the A/D line to decline rapidly (no sign of that), there is now strong pressure on price to "get in step."
During the 1960s, at the time when silver was removed from circulating coinage, the amount of silver stockpiled around the world was about 6.5 billion ounces (Boz). In 1980 the stockpiles of silver bullion were estimated at 2.5 Boz. Since then an estimated 13 Boz have been mined, while an estimated 15 Boz have been used up. Silver in most industrial applications is not yet valuable enough to be recovered for recycling. For decades the amount of silver that is mined has failed to meet the demand for silver. In the meantime the uses for silver continue to expand. Today, if just one billionaire decided to buy $1B worth of silver, he would have a hard time getting his order filled. In the process this order would cause a massive price increase.
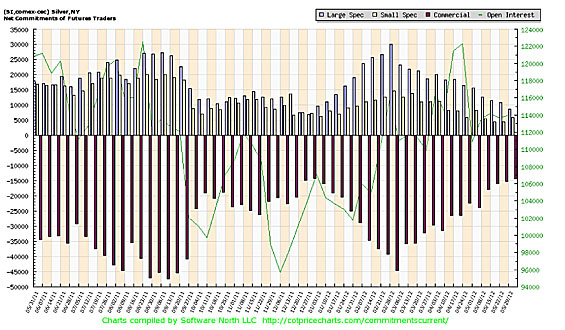
This chart, courtesy ofCotpricecharts.com, shows the net short position of commercial silver traders is at its lowest (14,000 compared to 15,000 last week), since December 2011. Silver was trading at $27.86/oz at that time, and during the following two months the price rose to $35.14/oz.
Summary: In the history of civilization, there is not one country that escaped the destruction of its fiat currency, once monetary inflation became part of the process. . .Not one!
Fundamentals are supporting the current bull market in the metals, as central banks are adding to the money supply at double-digit rates. The technical indicators, along with seasonal indicators, are pointing to a resumption of the bull market now that the correction that began in September 2011 has pretty well run its course. In the words of W. D. Gann, "hen time is up, price will reverse."
Peter Degraaf
Peter Degraaf is an online stock and bullion trader with over 50 years of experience. He produces a daily report for his many subscribers. For a sample copy send him an e-mail ([email protected]) or visit his website www.pdegraaf.com.
Disclaimer: Please do your own due diligence. Investing involves taking risks. I am not responsible for your trading decisions.


