Here is a chart that they have obviously overlooked:
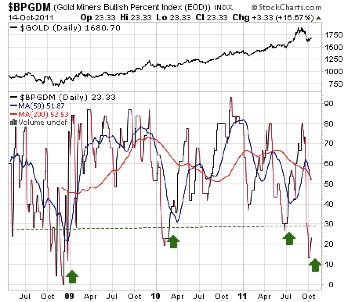
Featured is the 'Bullish Percentage Index' from the GDM gold producers, with the price of gold bullion added for comparison at the top. The index is turning up at the most oversold point since the credit crisis of 2008.The gold price then rose from $760 to $1010 over the next 3-4 months. Since the credit crunch, every time this index has dropped below 30%, it has turned out to be a buying opportunity. Why would anyone expect the price of gold this time to produce a different outcome?
Every minute of the day the central banks of the world put out $2 million (M) in new currency. At the same time the world's mines produce 90 ounces of gold. The ratio is 22,000 to 1. As long as this process continues, gold will rise.
"Gold is an expression of the world's justifiable distrust of the way our central bankers conduct their affairs." -Jim Grant
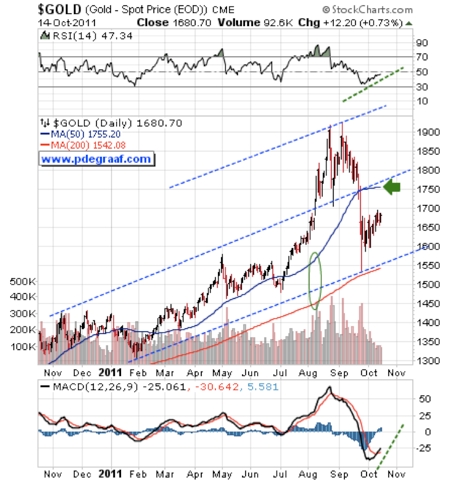
Featured is the daily gold price chart. Price became temporarily overbought in September and the correction, instead of finding support at the 50DMA, fell off a cliff (was pushed over the cliff?), and needed support at the 200DMA. There it became oversold and the bounce off the 200DMA sets up a target at the green arrow. The supporting indicators are turning positive (green lines) with lots of room to rise. The 50D is in positive alignment to the 200D (green oval), and both are rising (bullish). Any short-term pullbacks along the way should be viewed as buying opportunities.
Central banks have an estimated $1.5 trillion (T) worth of gold on their books. The amount of privately held gold has been pegged at $1.5T also. The total of world financial assets is approximately $200T. A shift of this 1% out of these $200T into precious metals will send gold and silver through the roof.
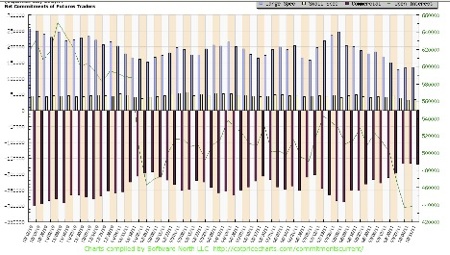
This chart, courtesy of Cotpricecharts.com, shows the 'net short' position by commercial traders remains very low. There are 169,000 net short positions reported this past week, compared to 165,000 the week before. This chart continues to be the most bullish of the past 12 months. It shows that commercial traders are hesitant to take on short positions.
"Determine what is best for the government and know that is what the powers are working to make happen. Inflation is what is 'best' for a government with enormous debt." -Ayn Rand
The five basic reasons for the decline and fall of the Roman Empire:
- The undermining of the sanctity and dignity of the home, which is the basis of human society.
- Rising taxes, the spending of public money for bread and circuses for the masses.
- The mad craze for pleasure becoming each year more exciting, more brutal, more immoral.
- The building of great armaments when the real enemy was within, the decay of individual responsibility.
- The decline of religion, fading into mere form, losing touch with life, losing power to guide the people. - Edward Gibbon (The Decline and Fall of the Roman Empire)
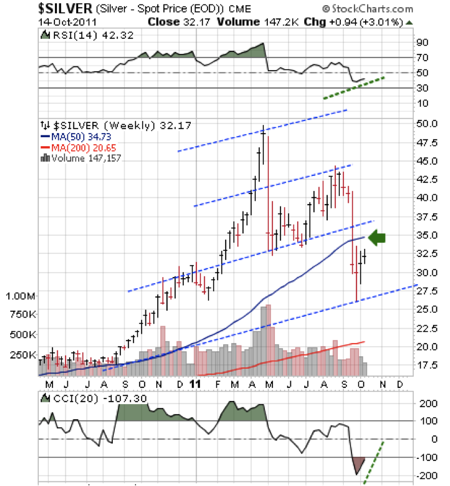
Featured is the weekly silver chart. Price closed at the highest level in four weeks and the supporting indicators are turning up from the most oversold readings since the 2008 credit crunch. The first target is at the green arrow. Once silver breaks out above the green arrow, the next target is at 40.00. According to the USGS a total of 46 billion ounces of silver have been mined so far. The estimated total for gold is 5 billion ounces. The ratio is 9 to 1. Keep in mind that gold is recycled will silver is primarily 'used up'. A 9 to 1 ratio puts silver at $185. The conclusion is that silver is currently severely underpriced.
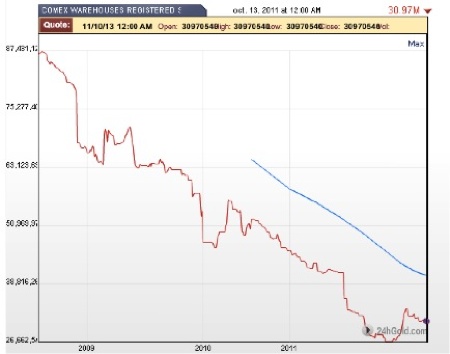
The lower gold and silver prices are forced down via manipulation, the higher they will rise in the future. When the price of any commodity rises, it increases incentive to produce and decreases incentive to consume. The longer a price is artificially depressed, the more pressure builds on the price, due to a lack of increased production, and due to a lack of constraint on consumption.This chart courtesy 24Hgold.com shows the number of registered ounces of silver at the COMEX continues to decline. When this number (currently at 30.97 million) reaches zero, the COMEX will be out of silver to deliver against futures contracts.
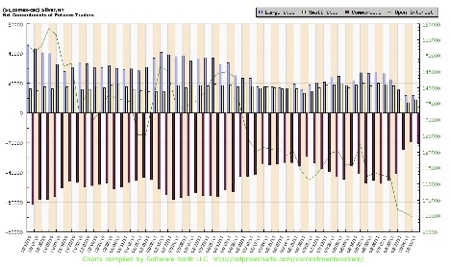
This chart, courtesy of Cotpricecharts.com, shows the number of 'net short' positions on the part of commercial silver traders increased from 19,000 the previous week to 21,000 this past week, leaving the chart pattern once again very bullish, as it indicates that commercial traders are still hesitant about going short. The last time the 'net short' reading was this low was October 2008 while the price was 9.35; silver rose over the next few months to 15.00, an increase of 60%.
Here are the three reasons why some analysts go out on the limb and predict lower gold and silver prices:
#1 They do not understand the gold market. #2 They have not bothered to look at the fundamentals. #3 By predicting lower prices they will either be right or wrong.
If they are right, they can brag. If they are wrong they know you'll forgive them because you will be in a good mood when you portfolio is rising.
My advice is simple: Keep a written record of the predictions you read. It will help you to eliminate the analysts who do nothing but flip a coin in order to come up with a prediction.
In 1980 the U.S. national debt stood at $930 billion (B). Gold was briefly priced at $850. Today the national debt (without counting off-budget commitments) is over $13T, or 14 times the 1980 deficit. Gold is priced at $1680—barely double the 1980 high! By comparison—gold is cheap!
Summary: During 18 of the past 22 years gold has produced a Christmas Rally. The rise usually begins in September and this year should be no exception.
Disclaimer: Please do your own due diligence. Investing involves taking risks. I am NOT responsible for your trading decisions.
Happy trading!
Peter Degraaf
Peter Degraaf is an online stock trader with over 50 years of investing experience. He produces a daily report as well as a weekly report for his many subscribers. For a sample copy of a recent report send an email to [email protected] or visit his website www.pdegraaf.com.