
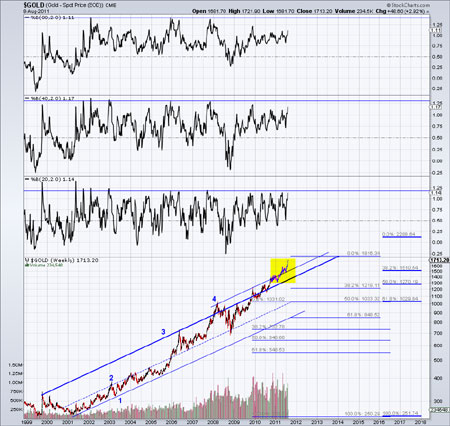
In the chart below we show four different but parallel trendlines. Trendlines one and two contained the bull market from 2001 to 2005 while trendlines two and three contained the bull market from 2006 to early 2010. Since then the market has tried to break and hold above trendline four. It happened in April of this year and the recent low was a successful retest of the breakout. Secondly, we'd like to point out the strong Fibonacci targets at $1820 and $2300.
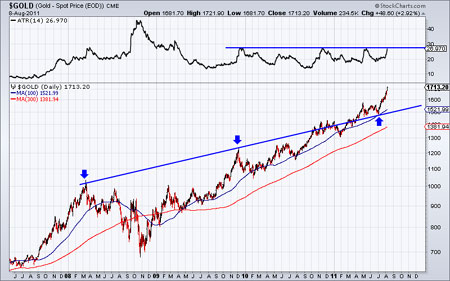
The next chart is a zoomed in look of the fourth trendline, which connects the 2008 and 2009 highs and the June 2011 low. The top indicator is a volatility indicator. If it breaks higher then it could signal the start of parabolic move. Gold now has strong support at $1580 to $1600. A $100 or even $150 pullback wouldn't change the current state of acceleration.
Sentiment has become more bullish but that is only a reflection of an acceleration in a raging bull market. More and more will pile in and the trend accelerates, but so too does volatility. Readers are advised to increase positions on pullbacks and to consider gold and silver shares, which are setting up for a fantastic 2012 and 2013. If you'd like professional guidance in riding and profiting from this acceleration then we invite you to consider our premium service.
Good Luck!
Jordan Roy-Byrne, CMT
[email protected]


