Your face is so unclear.
I try to pay attention,
Your words just disappear.
-Staind, "Epiphany" lyrics
A few weeks ago, traders and market prognosticators were frantically trying to determine if the S&P500 would hold the 200-period moving average. As it turns out, the 200-period moving was able to hold sellers in check. After a few days of grinding around, the S&P500 pushed higher. The price action has been spectacular the past two weeks and the S&P500 could potentially breakout to new 2011 highs. Only Mr. Market can push prices to the brink of disaster only to have them break to new highs in a matter of weeks.
Last week, I was of the opinion that if a major descending trend line did not hold, we would see the S&P500 index push into a major resistance area around the SPX 1,340 – 1,350 area. I posited the following chart in my most recent article:
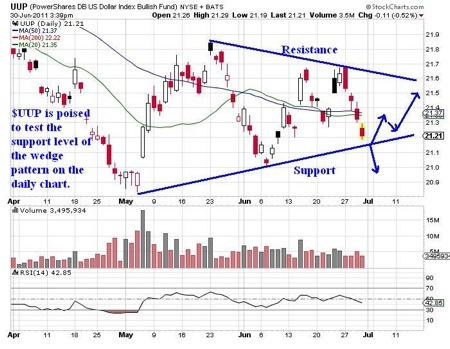
As it turns out, the descending trend line was taken out and price has jammed right into the major resistance area detailed in the chart above. In fact, yesterday the index was on the verge of pushing through the key resistance area and could likely test the 2011 highs in the near future.
Current price levels offer a multitude of outcomes depending on price action, news items, and economic reports. Predicting the future is a fool's game, particularly in a marketplace full of government intervention. With that being said, I am going to use this article to point out a few key items that traders should be aware of in coming weeks.
Bullish Camp
For S&P500 bulls, the price action as of late has been impressive and undeniably bullish. Bulls would point out that the U.S. Dollar Index futures have moved higher and equity indices were able to shrug it off, which is generally an unusual set of circumstances considering the greenback's recent strength.
Additionally the bulls will note the improving economic data points as well as last week's strong manufacturing report. Another key area that many bulls are pointing out is that earnings forecasts for the 2nd quarter are not expected to be strong according to the analysts. The hidden potential for earnings expectations to be blown away is clearly present.
From a technical standpoint, nearly every major resistance level has been knifed through with ease. In fact, the past two weeks resistance levels have been nonexistent. If we look at the SPX Weekly chart we can clearly see a golden cross represented by the 50-period moving average pushing well above the 200-period moving average. The chart below illustrates the golden cross:
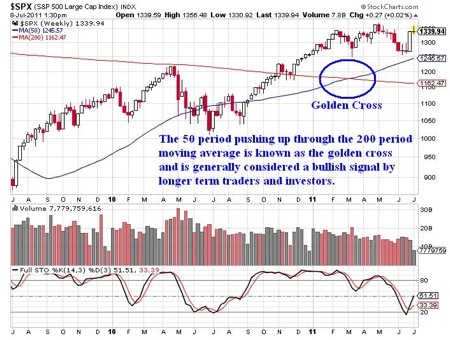
Generally speaking, a golden cross on a weekly chart is viewed as bullish momentum. Speaking of momentum, based on recent price action the longer-term momentum remains below historical long-term levels over the past year. The following chart, courtesy of Barcharts.com, plots the number of stocks currently trading above the 200-period moving average:
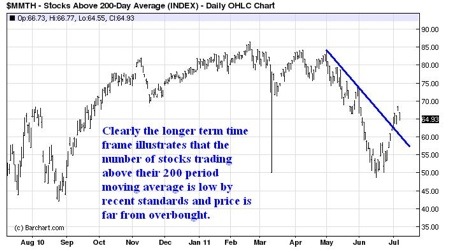
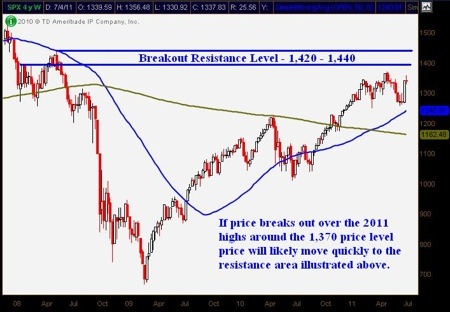
Over the past year, the current momentum to the upside in the longer-term timeframe reveals the potential for stocks to move considerably higher. It would take a huge move for equities to become overbought in this metric of study in the longer-term timeframes. Overall, conditions for higher prices are clearly present, and traders and investors alike may see a major breakout in the near term over 2011 highs. If a breakout plays out, readers can expect to see the S&P500 rally to a resistance area that is shown below on the SPX daily chart:
Bearish Camp
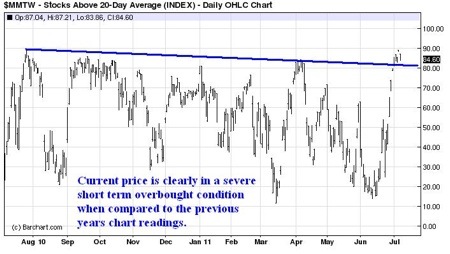
The bears would point out that the present move higher in the S&P500 has been parabolic. When price action goes parabolic in either direction the pending profit taking/correction is generally just as harsh. The S&P500 has rallied seven of the last eight sessions and has moved over 7% higher since testing the 200-period moving average on the daily chart on June 16th. It is without question that in the short term the S&P500 is severely overbought. The momentum chart below courtesy of Barcharts.com shows the number of stocks trading above their key 20-period moving averages:
In addition to the short-term overbought nature of the S&P500, the daily and weekly charts clearly illustrate a head-and-shoulders pattern. The head-and-shoulders pattern is a typical characteristic of a topping formation that is often found at several major historical tops. The daily chart below illustrates the head-and-shoulders pattern:
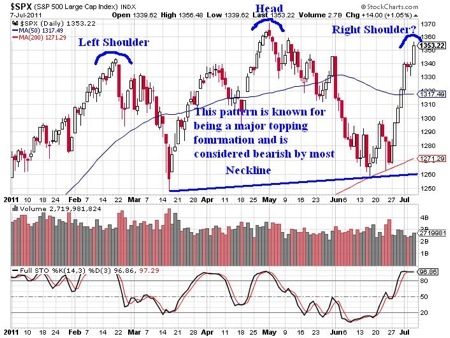
This particular head-and-shoulders pattern is not getting a lot of recognition in the media, which lends it a bit more credence. If we start hearing about this pattern on CNBC or FOX Business, I will expect the pattern to fail. Call me a contrarian, but in the past when major television personalities were constantly talking about chart patterns, they almost always failed.
Besides just technical data points, continued worries stemming from the European sovereign debt crisis helps the bear's case further. In the event of a major default in the Eurozone, the implications to the financial sector of the U.S. economy will come into focus. It is widely expected that a banking crisis in Europe could spread to some degree to the large money center banks in the United States. Clearly this would have negative implications on price action in domestic equity markets.
In addition to the European debt crisis, the United States government has a looming credit crisis of its own. With politicians currently arguing over whether to raise the debt ceiling, bears point out that if the United States defaulted on its debt (unlikely) the implications would be severe. However, many traders and economists point out that the end of QE2 may have dramatic implications on price action as well. The current uncertainty around the world lends itself in favor of the bears.
As I am writing this, the unemployment number just came out and it was far worse than the market expected based on Thursday's strong ADP employment report. At this point in time, we are getting heavy selling in the S&P500. While this could be the beginning of a larger move, it might make sense that sellers are stepping in and taking profits. The real question for traders and investors alike is what the future holds in coming weeks. Do we get a small correction from current prices before breaking out to new 2011 highs or are we putting in a dreadful double top that leads to the return of the bear?
Only time will tell . . .
Take a look at www.OptionsTradingSignals.com/specials/index.php today for a 24 hour 66% off coupon.
JW Jones


